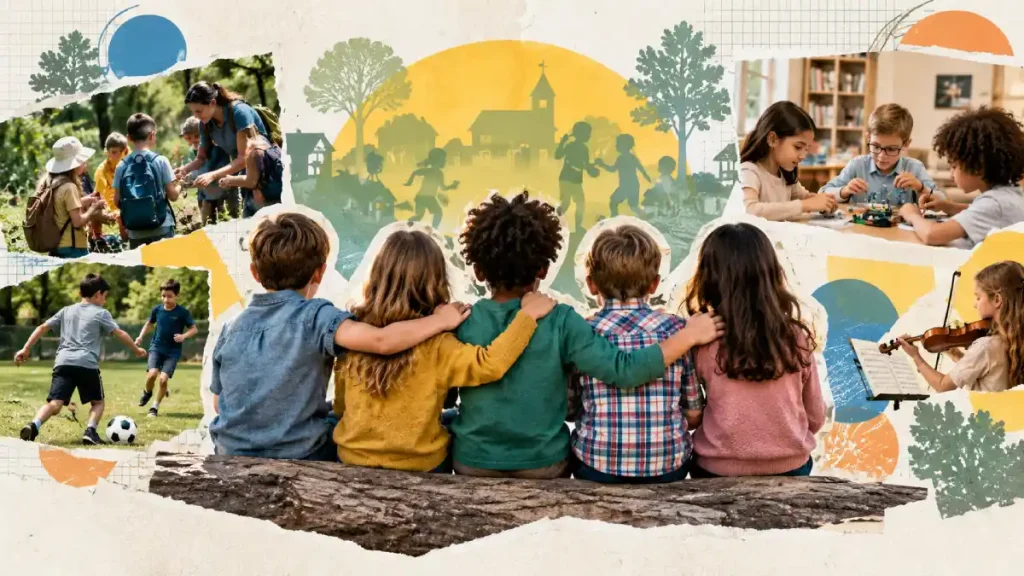

A mother in suburban Ohio withdraws her child after persistent bullying, quickly finding neighborhood cooperative classes. In Chicago, an education researcher inspects developmental checklists, expecting social hesitation, but finds home learners directing community youth theater.
These everyday cases illustrate how home education works in practice. While critics question peer contact, millions of families build active social networks outside conventional classrooms. The statistical breakdown below examines national enrollment, parental motivations, standardized developmental benchmarks, athletic access, mental health metrics, and adult civic engagement.
Federal survey estimates of K-12 students learning at home
Standardized adaptive behavior rating for home educated learners
Home learners active in at least one organized community program
Young adult alumni voting in national elections versus baseline
National Homeschool Population and Socialization Scale
Home education expanded rapidly beyond its historic religious base into an established national educational choice. Modern research surveys track millions of home-instructed students learning in diverse communities across every state.
- Federal survey datasets estimate between 3.4 million and 4.3 million K-12 students learn at home nationwide.
- Home learners account for approximately 6.0% to 8.0% of total school-age children in the United States.
- National survey archives show homeschooled students living in all 50 states across urban, suburban, and rural towns.
- State departments of education track between 1.9 million and 2.7 million home students across formal state registries.
- Federal household metrics recorded peak participation above 11.0% before stabilizing near 6.2% nationwide.
- State statutory registries monitor over 60% of school-age children through active municipal notification filings.
- Nationwide survey models record a sustained 50% enrollment expansion compared to 2019 baseline levels.
- Roughly 1.5 million children learn in zero-notice states where public agencies collect no annual headcounts.
Parental Motivations and School Environment Concerns
Families frequently choose home instruction to protect their children from toxic social environments. Federal surveys reveal that safety concerns and peer hostility drive household withdrawal decisions far more than simple academic preference.
- National household education surveys report 80% of homeschool parents cite school environment conditions as a primary motivation.
- Federal youth safety surveys confirm that 28% of traditional students ages 12 to 18 encounter school bullying.
- Federal education records show 25% of parents rank negative school environments as their single most important motivator.
- Earlier federal benchmark surveys documented 34% of home educators naming negative school environments as their top concern.
- National survey tables show 75% of families choose home instruction to strengthen family bonds and protect daily schedules.
- Federal survey datasets show 85% of home educators pursue custom schooling to preserve specific moral or religious values.
- Parents cite negative peer pressure, substance exposure, and physical safety as decisive factors when leaving public classrooms.
- Academic dissatisfaction prompts over 60% of home-educating parents to create customized daily curricula for their children.
Standardized Social Skills Ratings and Behavioral Benchmarks
Psychological evaluations consistently refute the stereotype of the socially awkward homeschooler. Standardized assessments measuring cooperation, empathy, and behavioral maturity consistently place home learners at or above national peer baselines.
- Controlled evaluations using the Vineland Adaptive Behavior Scales place home-educated students in the 84th percentile.
- Self-concept evaluations using the Piers-Harris Children’s Self-Concept Scale record healthy to elevated self-esteem across home learners.
- Direct observation assessments using the Child Behavior Checklist document significantly fewer problem behaviors among home learners.
- Psychological evaluations find identical assertiveness scores when comparing home students to traditional classroom peers.
- Trained independent observers record home-educated children displaying lower physical and verbal aggression during mixed-group activities.
- Social Skills Rating System assessments show home-educated students scoring above national norms on total social competency.
- Standardized subscale measures confirm superior ratings for home students in cooperation, assertion, empathy, and personal self-control.
- Comparative peer studies place traditionally schooled control cohorts at the 27th percentile on standardized social maturity metrics.
Homeschool Co-op Enrollment and Cooperative Learning
Cooperative learning hubs form the organizational backbone of modern homeschool communities. Parents pool professional backgrounds, rent community facilities, and organize collaborative laboratory experiments and academic seminars.
- Recent community surveys indicate over 88% of homeschool households rely on outside support groups or local learning co-ops.
- Parents holding graduate degrees show a 10 percentage point higher likelihood of joining formal academic cooperative programs.
- Traditional homeschool cooperatives meet 1 to 2 days per week for 3 to 6 hours of structured group coursework.
- Member surveys report 55% of families join local cooperative learning networks specifically to secure weekly peer friendships.
- Academic co-op classes maintain favorable student-to-teacher ratios between 6 to 1 and 10 to 1.
- Volunteer parent coordinators dedicate between 10 and 15 hours per week to managing cooperative schedules and facility rentals.
- Community directories identify approximately 28,000 organized homeschool cooperatives active across American municipalities.
- Cooperative programs pool parent subject specialties to teach laboratory sciences, foreign languages, fine arts, and speech debate.
Extracurricular and Community Activity Participation
Home-educated learners spend significant portions of their instructional week engaged in public community life. Rather than remaining isolated at home, students access civic groups, athletic facilities, and fine arts programs.
- Homeschool families log an average of 11.5 hours per week participating in structured activities outside their homes.
- Home-educated children participate in an average of 5.2 distinct extracurricular activities each week.
- Survey records show 98% of homeschooled students participate regularly in at least one organized community activity.
- Fine arts programs engage 65% of home-educated children through private music instruction, community choirs, and youth theater.
- Group field trips and nature study clubs provide multi-age social contact for 80% of home-educating families.
- Youth sports leagues, martial arts dojos, and dance academies provide weekly athletic socialization for over 70% of students.
- Community scouting packs and 4-H clubs enroll over 35% of home-educated students in suburban and rural districts.
- Volunteer service initiatives involve more than 50% of homeschooled teenagers in recurring community projects.
Athletic Participation and Interscholastic Sports Access
Athletic participation supports physical development and team socialization for home learners. State laws increasingly guarantee public school athletic access, while independent homeschool sports associations coordinate national tournaments.
- State legislative records show over 30 states enact Tim Tebow laws granting public school sports access.
- Over 20 states still restrict homeschool participation in interscholastic public school athletic tournaments.
- Surveys show 68% of home-educated student athletes compete through community leagues and private sports clubs.
- Independent sports organizations operate dedicated competitive leagues across basketball, soccer, cross-country, and track.
- National homeschool championships register over 1,540 competitive basketball and volleyball teams each season.
- Regional tournaments host more than 400 teams at major independent homeschool athletic championship events.
- Community travel ball and local youth clubs provide athletic leagues without public school enrollment requirements.
- State sports associations require home athletes to satisfy district residency and baseline academic standards.
Bullying Avoidance and Peer Pressure Comparisons
Escaping school-based harassment remains a leading catalyst for home education. By removing children from hostile peer environments, home learning protects emotional stability and reduces chronic stress.
- Federal crime and safety reports show 28% of public middle and high school students experience bullying.
- School climate surveys indicate 16% of traditionally schooled adolescents report persistent cyberbullying by classmates.
- Longitudinal youth studies link peer victimization in traditional schools to chronic academic anxiety and school refusal.
- Adolescent surveys show home learners report significantly lower peer pressure regarding substance use and antisocial behavior.
- Homeschool parents cite emotional safety as a primary reason for leaving disruptive neighborhood school settings.
- Research records indicate 90% of home-educated children report feeling safe from physical and social intimidation.
- Comparative surveys indicate homeschooled students experience peer harassment rates under 5% across verified cohorts.
- Clinical studies report immediate reductions in student stress hormones after withdrawing from hostile classroom environments.
Mental Health, Anxiety, and Self-Esteem Indicators
Mental health research reveals substantial psychological advantages for students educated outside high-stress school environments. Flexible schedules, adequate sleep, and supportive family dynamics help prevent chronic adolescent anxiety and depressive symptoms.
- Major national survey datasets record former homeschoolers reporting elevated levels of life satisfaction, gratitude, and optimism.
- Adolescent cross-sectional studies show comparable baseline stress metrics between home-educated and classroom peers.
- Survey records show 82% of homeschool graduates describe their childhood home instruction as emotionally supportive.
- Controlled evaluations record higher psychological self-concept scores among homeschooled students across elementary grades.
- Youth mental health studies highlight parental responsiveness as an effective buffer against adolescent social isolation.
- National longitudinal benchmarks show adult homeschoolers reporting the lowest levels of perceived daily helplessness.
- Clinical comparisons find lower internalizing behaviors, including reduced depression and generalized anxiety, in home learners.
- Pediatric health reviews show flexible sleep schedules reduce adolescent depressive symptoms in home education settings.
Screen Time and Digital Socialization Trends
Digital technology enables home-educated students to access specialized coursework and build collaborative friendships nationwide. However, parents actively balance digital communication with face-to-face community routines.
- Younger children ages 8 to 14 average approximately 3.5 hours of daily screen time across modern households.
- Youth screen metrics show adolescents spend between 6.0 and 9.0 hours daily on recreational digital devices.
- Surveys indicate 70% of homeschooled teens maintain active online friendships alongside local in-person clubs.
- Over 65% of home-educating households set structured daily boundaries distinguishing academic from leisure screen use.
- Children between ages 8 and 14 spend approximately 2.0 hours daily on recreational social video platforms.
- Homeschool families integrate digital study groups to connect with peers across distant geographic communities.
- Virtual cooperatives and moderated debate forums provide structured digital social interaction for home learners.
- Pediatric guidelines emphasize preserving face-to-face community interaction to prevent recreational screen displacement.
Cross-Age Interaction and Multi-Generational Dynamics
Traditional schools group children strictly by birth year, creating artificial age silos. In contrast, home education embeds children in multi-generational environments where they learn to interact comfortably with all ages.
- Homeschool cooperative classes frequently combine multi-grade cohorts spanning 2 to 4 academic grade levels.
- Observational studies confirm homeschooled children interact regularly with infants, younger children, peers, and adults.
- Developmental psychology research indicates multi-age grouping strengthens empathy, cooperative play, and verbal fluency.
- Family interaction studies show homeschooled siblings display closer emotional attachments and reduced sibling rivalry.
- Community volunteering connects over 50% of home-educated youths directly with senior citizens and local organizers.
- Mixed-age learning groups reduce social competition while encouraging older students to mentor younger peers.
- Direct behavioral observations record home learners demonstrating superior communication ease during adult conversations.
- Child development studies contrast age-segregated classrooms with the natural multi-generational structure of home education.
Neurodiverse Learners and Specialized Social Development
Children with autism, attention differences, and sensory processing sensitivities often struggle in crowded, noisy public classrooms. Home education offers tailored environments where neurodivergent learners develop social confidence at their own pace.
- Surveys indicate approximately 25% of homeschooling households include at least one child with special learning needs.
- Parent surveys show 36% of families switching to homeschooling cite inadequate special education services in schools.
- Surveys report 84% of parents of neurodiverse children observe marked social confidence gains after homeschooling.
- Special education datasets report that up to 38% of home-educated students have diagnosed neurodivergent conditions.
- Parental pacing enables students with learning differences to pursue special interests and build self-advocacy.
- Individualized social environments reduce school-induced panic attacks and severe separation anxiety in sensitive learners.
- Home education eliminates classroom sensory overload for children diagnosed with autism spectrum disorder and ADHD.
- Tailored instruction schedules allow neurodiverse children to master social skills without daily peer ridicule.
College Social Adjustment and Campus Retention Rates
The transition to higher education tests the social readiness of home-educated students. University datasets confirm that homeschool graduates adapt smoothly to campus life, earn higher grade point averages, and graduate at superior rates.
- National university averages report traditional high school graduates complete degrees at a 57.5% to 59% rate.
- Standardized evaluations using the College Adjustment Scale show normal to superior social adjustment among homeschool freshmen.
- Statistical matching studies show demographic background factors explain significant portions of university retention gaps.
- Institutional higher education studies record a 67% college graduation rate for homeschooled students.
- First-year university surveys indicate home-educated freshmen report lower levels of social depression and peer anxiety.
- College retention models report fall-to-fall persistence rates of 88.6% for home learners compared to 87.6% overall.
- University registrar datasets document higher cumulative grade point averages among home-educated undergraduates.
- Campus activity records confirm home-educated college students participate actively in student organizations and volunteer groups.
Adult Civic Participation, Volunteering, and Community Life
Adulthood outcomes provide the ultimate test of childhood socialization. Long-term research demonstrates that former homeschoolers become active, civic-minded adults who vote, volunteer, and contribute to local public life at high rates.
- Independent survey datasets confirm long-term homeschool graduates participate in unpaid community volunteer work at elevated rates.
- Alumni survey records indicate former home learners volunteer predominantly within civic networks matching family values.
- Civic literacy evaluations show only 4.2% of adult homeschool graduates find political processes too complex to understand.
- Adult survey benchmarks record homeschool alumni contributing money and volunteer hours to political and civic causes.
- Long-term homeschoolers report strong community integration through neighborhood associations, charitable clubs, and local programs.
- National civic surveys report 76% of young adult homeschoolers vote in national elections compared to 29% nationwide.
- Alumni survey datasets document high rates of marital stability and active local neighborhood leadership.
- Over 95% of older home-educated adult cohorts report regular voting participation across municipal and federal elections.
Homeschool vs Public School Social Benchmarks
Outcome Comparison| Social Benchmark | Homeschool | Public Peers | Variance (Δ) |
|---|---|---|---|
| Social Maturity Percentile | 84th | 27th | +57 pts ▲ |
| College Graduation Rate | 67% | 59% | +8 pts ▲ |
| Fall to Fall Persistence | 88.6% | 87.6% | +1.0 pt ▲ |
| Young Adult Voting Rate | 76% | 29% | +47 pts ▲ |
| Peer Harassment Exposure | Under 5% | 28% | -23 pts ▼ |
Methodological Critiques and Sample Selection Bias
Scholars emphasize that homeschool research literature contains significant methodological limitations. Because participation in studies is voluntary, published data often overrepresents motivated, well-resourced families.
- Academic research reviews highlight heavy reliance on convenience and volunteer samples within homeschool literature.
- Homeschool research critics emphasize that self-selected survey cohorts overrepresent highly educated, affluent households.
- Policy researchers observe that lack of mandatory reporting prevents creation of complete national random samples.
- Peer-reviewed meta-analyses call for longitudinal randomized tracking to separate family background from home instruction effects.
- Over 80% of published homeschool socialization studies rely on parental self-reports rather than neutral blind testing.
- Empirical researchers note that public school binary comparisons fail to isolate socioeconomic status from educational method.
- Statisticians point out that positive socialization averages do not guarantee uniform experiences across all home learners.
- Independent evaluators note that under-resourced families facing social friction rarely participate in voluntary studies.
Hybrid Homeschooling and Collaborative Pod Social Networks
Hybrid schooling represents one of the fastest-growing sectors in American education. By combining part-time classroom attendance with home-based study, hybrid models offer families structured peer cohorts with flexible schedules.
- National hybrid school surveys indicate more than 24% of operating hybrid programs opened after 2020.
- Over 60% of hybrid school operators report waiting lists driven by families seeking flexible communal schooling.
- Modern hybrid homeschool models blend 2 to 3 days of classroom learning with home-based instruction.
- Hybrid educational models maintain small class sizes averaging 10 to 14 students per classroom guide.
- Surveys reveal hybrid homeschool parents prioritize part-time classroom environments to secure consistent peer socialization.
- Microschool networks and learning pods operate under legal homeschool statutes while providing structured peer cohorts.
- National homeschool hub data shows state enrollment figures increasingly include collaborative learning pods.
- Education analysts document a structural shift where families combine online tutoring, cooperative pods, and home instruction.
- Peer Environment Drives Exits (80% Cite School Concerns): Federal surveys show 80% of parents cite school environment conditions, and 25% rank negative school settings their single most important withdrawal motive.
- Community Life Is Near Universal (98% Join Activities): Home learners average 5.2 extracurricular activities each week, and families log 11.5 hours outside the home in clubs, leagues, and co-ops.
- College Persistence Runs High (67% Graduate Rate): Home educated undergraduates graduate at 67% compared to 59% for public peers, with fall to fall persistence of 88.6% versus 87.6% overall.
- Civic Participation Leads Peers (76% Youth Vote): Young adult alumni vote at 76% compared to 29% nationwide, and over 95% of older home educated cohorts report regular voting.
Recent Developments
State legislatures continue to pass policy reforms that reshape home education across the country. Universal school choice programs and statutory athletic access protections provide homeschoolers with expanded resources and public access.
- National homeschool enrollment stabilizes near 3.4 million students representing approximately 6.0% of K-12 children.
- Over 30 state legislatures now protect homeschooled student access to public school interscholastic sports and clubs.
- Ohio legislation recently streamlined home education rules by eliminating superintendent assessment approvals and hour mandates.
- Educational choice programs prompt over 400,000 families to register for state-administered education scholarship accounts.
- State legislative tallies show over 12 states enact universal Education Savings Accounts funding home-based educational options.
- Arizona, Florida, Iowa, and Utah distribute state education funds directly to families for approved homeschool curricula.
- Dedicated university research labs launched nationwide tracking tools to monitor post-pandemic state enrollment shifts.
- State policy debates intensify over testing and financial transparency requirements attached to universal school choice vouchers.
Editor’s Choice
The following standout figures represent the most essential statistical benchmarks defining home education, student socialization, and adult developmental trajectories.
- Across all 50 states, statutory athletic access laws in over 30 jurisdictions now protect home learners seeking public team sports participation.
- Federal surveys identify school environment concerns as a decisive motivator for 80% of home-educating households.
- Standardized Vineland Adaptive Behavior evaluations position homeschooled cohorts in the 84th percentile for social maturity.
- National household survey models establish that 3.4 million to 4.3 million children participate in home education across the nation.
- Degree completion registries confirm that home-instructed undergraduates achieve a 67% college graduation rate compared to 59% for traditional peers.
- Community activity audits demonstrate that 98% of home learners engage in regular extracurricular programs, averaging 5.2 distinct weekly activities.
- National civic metrics record a 76% young adult voting rate among homeschool graduates, nearly triple the 29% national baseline.
- Disability evaluations report that up to 38% of home-educated children have identified neurodivergent conditions thriving in tailored home settings.
Frequently Asked Questions
Standardized tests place home educated children in the 84th percentile for social maturity, above the 27th percentile public school average. Observational studies confirm home learners display lower aggression levels, higher self control, and strong cooperation during mixed group play.
Surveys show 98 percent of home educated children join community programs, averaging 5.2 distinct weekly extracurricular activities. Families spend roughly 11.5 hours each week outside the home in athletic leagues, fine arts, and academic cooperatives.
Federal surveys show 80 percent of parents cite school environment conditions, including bullying and peer pressure, as a key factor. Exactly 25 percent of home educators identify school safety as their single most important withdrawal reason.
Home educated undergraduates achieve a 67 percent college graduation rate, surpassing the 59 percent public school national average. Campus adjustment studies confirm higher cumulative grade point averages and an 88.6 percent fall to fall retention rate.
National surveys show 76 percent of young adult homeschool alumni vote in national elections, compared to 29 percent nationwide. Over 80 percent of former home learners report regular volunteer service within local community and charitable organizations.
Conclusion
The empirical record on homeschool socialization contradicts common cultural stereotypes of isolated, socially awkward children. Home learners participate in sports leagues, cooperative classrooms, fine arts ensembles, and community service projects at high rates. Standardized assessments consistently record normal to above-average social maturity, while university data confirms strong retention and degree completion.
Methodological limitations warrant caution, however, because convenience samples often overrepresent affluent, highly involved households. Meanwhile, the rapid rise of hybrid microschools and universal voucher accounts continues to reshape alternative education. These models blend flexible home learning with structured group environments, providing children with diverse social contact throughout their formative years.
Sources and editing
This article cites state departments of education, the National Center for Education Statistics (NCES), U.S. Census Bureau Household Pulse surveys, and peer-reviewed research.
We may use AI tools to sort tables or improve wording. A human reviewer checks the numbers, citations, and claims before publication.