
A school-board member drops a rounded national figure into a packet and treats it as a current headcount. A legislative aide has until Friday to put a percentage in a memo. Both are asking how many U.S. children are taught at home. Both will miss if they grab the wrong file.
The last federal parent survey is several school years old and interviews parents. Household-pulse estimates and state registration extracts are newer, cover a wider definition, and do not add up to the same unit.
A reporter lifting one sentence needs the year and the definition on that sentence, or the quote becomes a talking point. This article keeps students, school-age children, and households in separate columns, prints the year on each figure, and puts disagreeing cuts in the same sentence instead of blending them.
Homeschool Enrollment in the United States
- The most recent federal parent survey last measured homeschooling in the 2022–23 school year. It is a parent interview, not a 2025 or 2026 administrative headcount.
- That survey classified 3.4 percent of students ages 5–17 with a K–12 grade equivalent as homeschooled.
- Combined “instruction at home” (homeschool plus full-time virtual school) was 5.2 percent in 2022–23, up from 3.7 percent in 2018–19.
- Full-time virtual enrollment sat at 2.5 percent in 2022–23, including 1.8 percent enrolled as public or private virtual students and 0.7 percent counted as homeschoolers taking a full-time virtual program.
- Converted to students, the federal parent-survey homeschool count is about 1.76 million in 2022–23, up from 1.45 million in 2018–19.
- The 2022–23 student count is nearly the same as the 1.77 million the same survey family produced for 2012, which is why a rising share and a flat older headcount can appear in the same briefing.
- Parents who send a child to a public or private school for more than 25 hours a week are generally outside the federal homeschool definition.
- Twenty-one states still publish no annual homeschool participation count, so no single state roster can be added up to a national total.
- A February 2026 synthesis of 23 state files plus Census pulse data estimated 3.408 million K–12 homeschool students in 2024–25, with a stated range of 3.067 million to 3.749 million.
- That synthesis equals 6.262 percent of school-age children; the Census pulse cut for the same year read 6.530 percent.
- Pulse averages for 2023–24 put homeschooling at 5.92 percent of school-age children, private school at 9.92 percent, and public school at 84.16 percent.
- The prior pulse school year, 2022–23, was 5.82 percent homeschool, 10.06 percent private, and 84.12 percent public.
- Federal administrative membership counted 49,269,882 public-school students in 2024–25, including 3,949,735 charter students.
- Charter membership was 3,851,093 in 2023–24, a one-year rise of 98,642 students, or 2.56 percent.
- Charter students were 8.02 percent of public-school membership in 2024–25. That share is inside the public total, not a separate pile of children.
- The latest weighted federal private-school estimate is 5,096,365 students in 2023–24.
- Catholic elementary and secondary enrollment was about 1.684 million in the 2024–25 reporting cycle, roughly half the 2024–25 homeschool point estimate.
- An earlier charter benchmark used in the same 2024–25 homeschool synthesis was 3.784 million charter students in 2023–24, close to the homeschool point estimate and below the later 2024–25 charter administrative count.
Homeschooling Growth Since the Pandemic
- Among states that publish counts, homeschool participation rose an average of 4.9 percent in 2024–25, more than double the pre-pandemic pace of about 2 percent a year.
- Eighty percent of those reporting states posted an increase in 2024–25.
- Thirty-six percent of reporting states set an all-time high in 2024–25, above their pandemic-year peaks.
- Year-over-year jumps in the same file included South Carolina 21.5 percent, Vermont 17 percent, Ohio 15 percent, and New Hampshire 14.5 percent.
- Louisiana’s increase in that file was 1 percent.
- Thirty states plus the District of Columbia publish annual counts; 28 of those jurisdictions had 2024–25 figures in the November 2025 update.
- Pre-pandemic national share estimates clustered near 2.8 percent to 3 percent of K–12 students, which is why later pulse and state-file shares near 6 percent read as a doubling of the share, not a doubling of every older student count.
- Advocacy tallies put the spring 2019 stock at about 2.5 million students, before the 2020 interruption.
Post-Pandemic Retention Rates and Multi-Year Trends
- In a longitudinal set of state-reported counts, 100 percent of sampled states recorded an increase in 2020–21, with a net gain of 313,783 students in that sample.
- The same series showed a net loss of 33,156 in 2021–22, and only 29 percent of those states were still growing that year.
- Net change in 2022–23 was a loss of 65,415, with growth in 17 percent of sampled states.
- The 2023–24 rebound in a 20-state cut was a net gain of 21,294, and 90 percent of those states were growing again.
- Massachusetts home-school enrollment in fall 2024 was 51 percent above fall 2019. Relative to pre-pandemic trends, local public enrollment in that state was about 2 percent lower in fall 2024, and private enrollment was about 14 percent higher.
- Wisconsin counted 32,891 homeschool students in the 2026 release, up nearly 6 percent from 2025, while public enrollment fell 1.7 percent (14,087 students) and private enrollment rose 0.1 percent.
- North Dakota recorded 5,943 homeschool students in fall 2025 against 694 in fall 2007, a 756 percent rise across those years with no major state-law rewrite in the agency’s account.
- Most states with multi-year files still sit above their pre-2020 baseline even after the 2021–23 dip.
Homeschooling by State
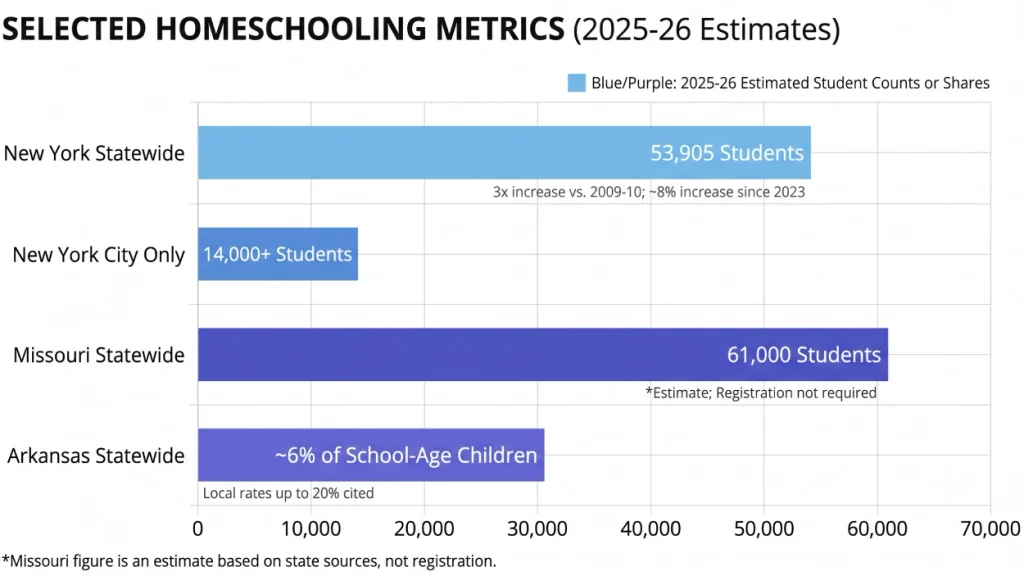
- New York counted 53,905 homeschool students in 2025–26, more than three times the 2009–10 figure, with growth of nearly 8 percent since 2023.
- New York City alone accounted for more than 14,000 of those students at last count.
- Missouri estimates run about 61,000 students, or 6.1 percent of school-age children, in a state that does not require families to register.
- Delaware’s reported homeschool roll moved from 3,467 students in 2022–23 to 4,466 in 2023–24.
- Arkansas’s statewide share has been cited near 6 percent, with some local areas near 20 percent.
- Continuous-growth states called out in the 2024–25 reporting update included Georgia, Minnesota, Nebraska, Ohio, Pennsylvania, and Wyoming among the record-high group.
- State files are not interchangeable with pulse shares. Registration states miss families in no-notice jurisdictions; pulse shares assign children from a household survey, not a student information system.
- California public enrollment fell by 612,000 between 2015 and 2025 as families shifted among charter, microschool, and home-based options; California still offers no statewide homeschool stipend.
Highest-Density States vs. Low-Participation Areas
- Pulse shares for 2023–24 were highest in Alaska at 16.15 percent, Tennessee at 10.75 percent, and Montana at 9.03 percent.
- The lowest 2023–24 pulse shares were Connecticut 3.01 percent, the District of Columbia 3.04 percent, and Massachusetts 3.39 percent.
- Alaska’s pulse share rose 3.6 percentage points from the prior year; Rhode Island rose 2.5 points and Tennessee 1.7 points.
- The District of Columbia’s pulse share fell 5.5 percentage points; Hawaii fell 1.7 points and Maryland 1.3 points.
- In 2022–23 the same pulse series listed Alaska at 12.56 percent, Tennessee at 9.02 percent, and West Virginia at 8.89 percent.
- The 2022–23 floor in that series was Rhode Island 2.86 percent, Massachusetts 3.14 percent, and New York 3.23 percent.
- High-share states are often smaller, more rural, or both. A large-state count can look big in students and still sit near the national pulse floor.
- Density is not the same as year-over-year growth. A high-share state can add few students while a mid-share state posts a double-digit percentage increase off a smaller base.
Homeschool Family Demographics
- A 2025 parent survey of homeschool households found 71 percent of those students homeschooled full time, 18 percent in a co-op arrangement, 8 percent in a hybrid school, and 3 percent in some other mix.
- In households with at least one homeschooled child, 35 percent also had a child in a traditional public school, 9 percent in a public charter, and 13 percent in a private school.
- Political identification in that survey: 44 percent Republican, 29 percent Democratic, 27 percent Independent; ideology ran 43 percent conservative, 25 percent liberal, 32 percent moderate.
- Religious attendance: 44 percent weekly or more, 25 percent less often, 31 percent never.
- White families were 69 percent of that homeschool-household sample against 57 percent of the U.S. population in the comparison the authors used.
- The same sample put Hispanic households at 15 percent (population 20 percent), Black households at 10 percent (14 percent), and Asian households at 5 percent (7 percent).
- A winter 2025 nationally representative parent survey (more than 2,400 K–12 parents) found 88 percent of homeschool parents using some supplemental support, against 44 percent of parents overall.
- Among homeschool parents in that survey, 44 percent used online resources, 29 percent joined co-ops, 27 percent took an online class, and 24 percent enrolled in an online school.
Household Income, Parental Education, and Racial Diversity
- The federal parent survey’s student mix in 2022–23 was about 29 percent students of color, up from 25 percent in 1998–99.
- Pulse estimates for 2022–23 put students of color near 40 percent of homeschoolers (60 percent white, 19 percent Hispanic or Latino, 12 percent Black, 2 percent Asian, 7 percent two or more or other).
- Within-group homeschool rates in the federal parent survey for 2022–23 were 5.1 percent of white students, 1.7 percent of Black students, and 1.8 percent of Hispanic students.
- On the composition cut of that survey, homeschoolers were about 6 percent Black, 14 percent Hispanic, 7 percent two or more races, and under 2 percent Asian.
- Pulse respondents in homeschool households during 2023–24: 9 percent lacked a high school diploma or GED, 29 percent held a diploma or GED, 33 percent had some college or an associate degree, and 29 percent held a bachelor’s degree or higher.
- An advocacy research compilation still cites 67 percent of homeschool parents with a bachelor’s degree or higher, against 37.7 percent of U.S. adults 25 and older. That is a different sample and a different year from the pulse education cut.
- Pulse household-income bands for 2023–24 homeschool households: 10 percent under $25,000; 8 percent $25,000–$34,999; 10 percent $35,000–$49,999; 13 percent $50,000–$74,999; 12 percent $75,000–$99,999; 13 percent $100,000–$149,999; 5 percent $150,000–$199,999; 5 percent $200,000 or more; 24 percent did not report.
- A 2023 achievement-test sample of 714 homeschool families reported a median family-income band of $75,000–$124,999, against a 2023 U.S. median family household income of $102,800.
Reasons Parents Homeschool
- In the 2022–23 federal parent survey, 83 percent of homeschool parents called concern about the environment of other schools an important reason.
- That same item was the most important reason for 28 percent, the highest single “most important” share in that table.
- Moral instruction was important for 75 percent and the most important reason for 6 percent.
- Dissatisfaction with academic instruction was important for 72 percent.
- Emphasizing family life together was important for 72 percent.
- Religious instruction was a reason for 53 percent; a nontraditional approach was a reason for 50 percent.
- Other special needs that parents said a school could not or would not meet: 21 percent. A physical or mental health problem lasting six months or more: 15 percent. A temporary illness: 2 percent.
- In the 2019 federal parent survey, environment was important for 80 percent and most important for 25 percent, so the 2022–23 “important” share on environment is higher than the last pre-pandemic reading on the same instrument.
- Religious instruction as the most important reason was 17 percent in 2011–12 and 16 percent in 2015–16 on earlier waves of the same survey family.
School Safety, Academic Customization, and Moral Instruction
- Environment in the federal items includes safety, drugs, and negative peer pressure. It is the modal “important” reason and the modal “most important” reason in 2022–23.
- Academic dissatisfaction as an “important” reason rose from 61 percent in 2015–16 to 72 percent in 2022–23 on that survey family.
- A 2025 New York City education-department survey of homeschool parents found 21 percent saying their children received a more rigorous education than public schools could offer.
- In a 2023 test-score sample of 1,149 homeschool students, 62 percent or more of families marked family life together or moral instruction as “extremely important.”
- Special needs the schools “can’t or won’t address” were quite or extremely important for 19 percent of that 2023 sample.
- COVID exposure or policy barriers were quite or extremely important for 13 percent of that sample, a minority reason two to three years after reopening.
- Desire to customize curriculum and pacing shows up in parent interviews and city surveys as rigor and teacher-quality control, not as a separate federal checkbox with its own national percentage.
- Moral instruction remains a high “important” score and a low “most important” score, which is the measurement pattern that gets flattened when someone quotes only one of the two columns.
Academic Achievement of Homeschooled Students
- A 2026 peer-reviewed nationwide achievement study is the first U.S. sample of that scope in more than 15 years.
- Mean percentiles in that sample landed between 75 and 79 across reading, language, math, social studies, and science, against a norm-group midpoint of 50.
- After controls for socioeconomic status and race or ethnicity, weighted mean percentiles were 74 to 82.
- Effect sizes versus the conventional-school norm group ranged from 0.74 to 1.03 across those five subjects.
- The analytic file covered 1,149 students and 714 families, with scores collected February through November 2023.
- A 2026 systematic review of peer-reviewed work found 62 percent of academic-achievement studies showing homeschool students statistically ahead of institutionally schooled students; the rest were mixed or null, not a single contrary pile.
- A 2015 study of Black homeschool students put them 23 to 42 percentile points above Black public-school students on the tests used in that paper.
- Parent teacher certification showed no clear tie to those 2023 scores. Five percent of the main instructing parents in that sample had ever held a state certificate, a figure that did not explain the subject gaps.
Standardized Test Scores and Grade-Level Equivalency
- Subject gaps versus the norm midpoint in the 2026 study were 29 percentile points in reading, 25 in language, 25 in mathematics, 26 in social studies, and 27 in science.
- A reading gap of 29 points is a rank shift to about the 79th percentile. It is not “29 percent more items correct.”
- Older cross-sectional work from 1999 on 20,760 homeschool students put grade-level medians between the 70th and 80th percentile nationally and between the 60th and 70th versus Catholic and private-school norms.
- Reviews still summarize the broader test literature as homeschool averages 15 to 25 percentile points above public-school means on the same kind of battery.
- Homeschool SAT and ACT means have historically run above the national mean, including older SAT total gaps of about 60 to 100 points, but the testing company no longer publishes a separate annual homeschool cohort.
- Score files in these studies are volunteer or vendor samples. They are not a random draw of every homeschooler, and they omit families who never test.
- States that require a test do not all use the same battery, the same grades, or the same submission rule, so a state testing mandate is not a national grade-equivalent series.
- Relatively few family predictors in the 2023 models explained the scores once income and race were in the equation.
Homeschooling Versus Public, Private, and Charter Schools
- Public-school achievement reporting runs through state assessments and the National Assessment of Educational Progress. Homeschool students are mostly outside those two systems, so a NAEP line and a homeschool vendor percentile are not the same exam.
- Charter schools remain public schools. Their students sit in the public membership file and usually take the state test; homeschool students generally do not.
- Private-school comparisons in the 1999 file already sat below homeschool medians and above the public norm. That is a three-way rank, not proof that every current private school trails every current homeschooler.
- Hybrid programs blur the comparison: a 2025 hybrid-school survey classified 61 percent of enrolled students as homeschoolers, 10 percent as school-enrolled, and 29 percent as mixed.
- Taking an education-savings-account award can move a child from an independent homeschool statute into a funded private or vendor program. The child’s weekday location may not change.
- Sector “wins” on a single test do not settle spending, access, or special-education coverage. Those are different columns.
- Families also mix sectors inside one household, so a public-school test average and a homeschool test average can describe siblings, not rival populations.
- Where a state tests homeschoolers only in selected grades, the homeschool mean in that state is a tested subset, not the full homeschool roll.
Performance Benchmarks and Student-Teacher Ratios
- Federal public-school pupil-teacher ratios in recent Digest tables sit in the mid-teens. That is certified staff FTE over enrolled pupils, not adults at a kitchen table.
- A parent instructing two children is a 1:2 adult-to-child ratio on paper and a different labor model from a district classroom.
- Hybrid schools in the 2025 survey averaged 197 students per campus, down from 263 in the 2024 survey wave and still above the 152 average in 2018.
- Inside those hybrids, mean enrollment was 147 in K–8 and 51 in grades 9–12.
- Typical on-campus days were 2.94 per week in K–5, 2.74 in grades 6–8, and 3.16 in grades 9–12.
- Nonpublic microschools in a 2025 sector file had a median enrollment of 22 students; public and public-charter microschools had a median of 36.
- Independent small day schools in one 2024–25 membership file posted operating expense per student of $45,189, a cost structure that is not a homeschool household budget.
- Benchmarks that treat “class size” as the quality variable miss the homeschool case, where the unit is often one family, not a scheduled section.
Hybrid Schools, Co-ops, and Online Supports
- The 2025 hybrid survey drew 66 schools in 29 states. It is a responding sample, not a census of every hybrid campus.
- Mean tuition in that wave was $5,743; the median was $4,928; the reported range ran from $0 to $27,000.
- Mean tuition in the same project was $4,158 in 2022, so the 2025 mean is higher even as average enrollment dipped.
- Curriculum labels in the 2025 wave: alternative or other 47 percent, classical 29 percent, regular or comprehensive 22 percent, special education and Montessori 2 percent.
- The federal parent survey for 2022–23 found 7 percent of enrolled or homeschooled students taking at least one virtual course and 93 percent taking none.
- Co-ops are parent-run group classes, not a federal enrollment category. They do not appear as a line in the public membership file.
- Online-school enrollment inside a homeschool statute and full-time virtual public school are separate legal statuses. Counting both as “homeschool digital” double-counts some children and misses others.
- Waitlists in hybrid leader comments were described as stable or growing in 2025 even where average campus size fell, which can happen when the responding set of schools changes.
The Rise of Microschools, Pods, and Digital Curriculum
- A 2024 research estimate put microschool enrollment between 750,000 and 2.1 million students as a main provider. That band is wide because there is no national microschool student ID.
- A 2025 sector analysis used the lower end of that range: about 750,000 students in roughly 95,000 microschools, near 2 percent of U.S. students if the 750,000 figure holds.
- Median microschool size in that file rose from 16 students in 2024 to 22 in 2025.
- Seventy-four percent of those microschools charged annual tuition and fees at or below $10,000; 65 percent offered a sliding scale or discount.
- Tuition bands: 48 percent charged $5,000–$10,000, 26 percent under $5,000, 16 percent $10,000–$15,000, 5 percent $15,000–$20,000, and 5 percent above $20,000.
- Median cost to educate one child in operating microschools was $6,500; the mean cost was about $8,124 in the 2025 file and $8,239 in a 2026 cost update.
- Among microschools that tracked growth, 81 percent reported 1 to 2 years of academic gains inside one school year. That is self-reported growth, not a state assessment.
- Thirty-eight percent of microschools received state school-choice funds in the later reading, up from 32 percent the year before. In Florida and Arizona samples, 87 percent of those campuses accepted the funds.
- At least half of U.S. microschools still operate in states with no publicly funded choice program they can tap.
School Choice Accounts and Public Funding
- A 2026 private-choice inventory counted more than 1.5 million students in 75 programs across 34 states, Washington, D.C., and Puerto Rico.
- About 2.8 percent of U.S. students used an educational-choice program in that 2026 check. That is program participation, not the homeschool share.
- Eight states enacted new private-choice programs or expanded existing ones in 2025, including Texas, Idaho, and Tennessee among the new or enlarged files.
- Compilers counted 21 ESA programs in 18 states as of a mid-2026 check.
- Six of those states were listed with universal eligibility: Arizona, Florida, Utah, Arkansas, Texas, and Iowa. Iowa’s award structure in some writeups excludes independent homeschoolers even when the state has a choice program.
- Taking the money usually changes legal status. The student becomes an ESA or scholarship participant and follows vendor, testing, and receipt rules that do not apply to an independent homeschooler in a no-notice state.
- Texas Education Freedom Accounts for 2026–27 posted more than 274,000 student applications, 95,934 initial awards, and a later cumulative award count near 110,000.
- The Texas homeschool or other-eligible-setting award is $2,000, against $10,474 for a participating private-school student and up to $30,000 for a qualifying private-school student with a disability.
Education Savings Accounts (ESAs) and State Voucher Programs
- Arizona’s Empowerment Scholarship Account roll was 92,362 students as of September 15, 2025, up from 77,496 a year earlier.
- Arizona’s reported “switcher” rate from other publicly funded options was 57 percent in that 2025 update. Projected year-end enrollment sat near 103,000.
- Florida’s Family Empowerment Scholarship for Educational Options listed 280,611 students; the Unique Abilities track listed 140,147.
- North Carolina’s Opportunity Scholarship listed 103,400 students; Ohio’s EdChoice Expansion listed 100,922.
- Published per-child ESA or scholarship amounts in 2025–26 guides clustered roughly from $3,000 to $10,000-plus, with Arizona near $7,200 and Florida often cited near $8,000.
- Alabama’s 2026–27 participating-school award is $7,000; the home-education award is $2,000, capped at $4,000 per family.
- West Virginia’s Hope Scholarship is cited near $4,600 to $5,435 depending on the year in the guide; several Hope rules still expect prior public-school enrollment.
- ESA dollars commonly cover curriculum, tutoring, online courses, and therapies. They do not automatically equal an independent homeschool budget, because unapproved spending is out of pocket.
- A family can appear in an ESA dashboard and disappear from a homeschool registration file in the same month if the state treats funded students as a separate sector.
Homeschool Laws and Regulation by State
- Homeschooling is legal in all 50 states and the District of Columbia. The statute that applies is the state statute, not a federal homeschool code.
- A September 2026 50-state comparison listed 10 no-notice jurisdictions: Connecticut, Idaho, Illinois, Indiana, Missouri, New Jersey, Oklahoma, South Carolina, Texas, and Wyoming.
- Alaska, Florida, Iowa, and Michigan are often filed as no-notice in casual lists, but each offers more than one legal route and only the least-regulated route skips notice.
- Legal guides disagree on the size of the “high regulation” bucket. One 2026 tally puts 3 states there; another puts 4 (New York, Massachusetts, Pennsylvania, Rhode Island); a third puts 6 states plus D.C.
- Roughly a dozen states require a standardized test for at least some homeschool grades. Others accept a portfolio or a teacher evaluation instead of a test.
- North Carolina requires a nationally standardized test each year and keeps the scores at the homeschool for inspection; parents do not routinely mail the state a score report.
- New Hampshire in 2026 eliminated mandatory homeschool notification and annual assessments under a new statute signed in July.
- Tennessee in 2026 broadened assessment options and removed some testing penalties; Idaho recognized homeschool diplomas for a wider set of vocational licenses.
- High-regulation states may still have large homeschool counts. Paperwork volume is not a population forecast.
High-Regulation vs. Low-Regulation Compliance Requirements
- No-notice states require no filing before a family starts. Low-regulation states typically want a notice of intent to the district or state and little else.
- Moderate-regulation states add a test, a portfolio, required subjects, or instructional-day counts.
- High-regulation states stack notice, testing or professional evaluation, and in some cases curriculum approval or home visits.
- Pennsylvania’s common high-regulation package includes an annual portfolio reviewed by a qualified evaluator and standardized tests in grades 3, 5, and 8.
- New York’s 2025–26 homeschool count can be large while the state’s packet rules stay detailed. Enrollment and compliance burden are separate facts.
- In the 2023 achievement sample, students in the least-regulated states scored higher in some subjects, especially math, science, and social studies, than students in low-regulation states. Moderate and high-regulation states did not show the same clean step-up.
- Advocacy reviews state that degree of regulation is not a reliable predictor of homeschool test scores across the literature. That claim sits next to the 2023 subject-level pattern; they are not the same finding.
- An ESA contract can impose testing and receipt rules that are stricter than the homeschool statute in the same zip code. Families on accounts follow the program rules, not only the homeschool chapter.
- Moving across a state line can change the legal route overnight. The child’s curriculum does not travel with a federal form.
Cost, Spending, and Taxpayer Savings
- A summer 2024 poll of more than 4,000 homeschool families across the 50 states, D.C., and Puerto Rico put average cash spending at $1,295 per elementary student and $1,636 per middle- or high-school student.
- The same poll put a two-child household near $3,104 a year in homeschool outlays.
- An advocacy research page still cites about $600 per student per year. That figure carries no year, sample size, or method on the page that repeats it.
- Public current spending per pupil was listed at $18,614 in one 2026 cost compilation that set the homeschool survey next to the taxpayer line.
- Multiplying a 2024–25 national homeschool stock estimate by 2025 public current spending per pupil produces an avoided-outlay comparison above $64 billion. That is not a check mailed to families.
- A Utah cost model that tries to match public-school extras (curriculum, field trips, activities) lands near $10,600 per student per year, far above the national cash-outlay surveys.
- Utah scholarship families in a 369-household survey expected about $9,000 per pupil in 2024–25 when scholarship dollars and out-of-pocket costs were added; about $2,000 of that was planned cash beyond the award.
- One private matching service quotes an annual homeschool range from $700 to $70,000, which is a product menu, not a mean.
- K–12 back-to-school retail spending on electronics, clothes, shoes, and supplies was $858 in 2025, almost unchanged from $853 in 2019, while prices overall rose 26.3 percent across those years.
Average Household Expenditure and Public System Savings
- New Hampshire Education Freedom Account homeschool spending in 2022–23 totaled $3.9 million, against $6.6 million directed to private schools in the same program year.
- Of that $3.9 million, about $520,000 (roughly one-seventh) went to activities often labeled extracurricular, including $46,000 at ski areas, $35,000 at martial-arts schools, and $16,000 at equestrian facilities.
- Amazon purchases were $1.4 million, or 35 percent, of the non-private-school EFA spending in that New Hampshire year.
- Summer and specialized education took $872,000, tutoring $266,000, and online learning programs $132,000.
- The average New Hampshire EFA award in the reporting around that file was $5,204 per child.
- Two-thirds of the Utah scholarship homeschool respondents said they expected to spend money beyond the award; about one-third planned to stay inside the scholarship.
- Public per-pupil figures omit some capital and benefit costs in some tables and include them in others. A homeschool cash survey omits the instructing parent’s time. Subtracting one from the other is a comparison of unlike units.
- Savings to a state budget appear only when the child leaves a funded seat. A child who was never in the public roll does not free a line item that was never spent.
College Admission and Adult Outcomes
- A 2026 systematic review of peer-reviewed or representative-sample studies found 13 of 24 adult-outcome papers (54 percent) favoring adults who had been home-educated; two favored conventional school; two were mixed; the rest showed no clear difference.
- Social and emotional development papers in that review ran 16 of 25 (64 percent) in favor of the homeschooled group.
- A 2023 adult survey that split people by years homeschooled found 20 percent homeschooled for only one year of primary and secondary school and 17 percent for all of K–12.
- Bachelor’s-or-higher rates in that survey: 45 percent for short-term homeschoolers, 46 percent for people never homeschooled, 29 percent for medium-term, 27 percent for long-term.
- Ending at a high school diploma or equivalent: 47 percent of medium-term homeschoolers, 41 percent of long-term, 27 percent of non-homeschoolers.
- Full-time employment was near two-thirds for short-term and long-term homeschoolers, and 48 percent for the medium-term group.
- Household income above the 2023 U.S. median (about $80,610) was 41 percent among short-term homeschoolers and about one-third among medium- and long-term groups, below the never-homeschooled comparison in that file.
- Federal student-aid rules let a homeschool graduate self-certify completion on the aid application. A GED is not required for that certification.
Acceptance Rates, GPA, and Career Preparedness
- Michael Cogan’s 2010 college study found first-year GPA of 3.41 for homeschool graduates versus 3.12 for classmates, fourth-year GPA of 3.46 versus 3.16, and graduation rates of 66.7 percent versus 57.5 percent.
- A survey of admissions officers in the same journal family found about 78 percent expected homeschool graduates to perform as well as or better than other first-year students.
- Large universities publish homeschool application paths. Extra validation (course lists, graded samples, outside exams) appears at some campuses and is stated in the application instructions.
- SAT and ACT homeschool means have historically sat above national means, but the testing organizations no longer issue a regular public homeschool cohort table.
- Long-term homeschoolers in the 2023 adult survey were more likely to do unpaid volunteer work, including with a religious organization other than their own congregation.
- Medium- and long-term groups in that survey were less likely than short-term homeschoolers to hold a bachelor’s degree, so “homeschooled adults” is not one labor-market file.
- An older unschooling follow-up (small volunteer sample) found 83 percent with some formal higher education and 44 percent in or finished with a bachelor’s program. Treat that as a selected sample, not a national rate.
- Career claims such as “higher entrepreneurship” circulate in fact-sheet lists without a current national earnings panel attached. Skip those until a dated sample exists.
Special Needs Homeschooling Statistics
- A 2025 analysis of homeschool choice found 25 percent of homeschooled students reported a disability, against 23 percent of students who were not homeschooled.
- Students with disabilities were about 16 percent of first-choice homeschoolers and 36 percent of second-choice homeschoolers in that paper. Second-choice means the family left a school after a placement problem.
- Public special education under the federal disabilities law reached 7,892,433 students ages 3–21 in fall 2023, up 3.4 percent from fall 2022, or about 15 percent of K–12 enrollment.
- Autism was the fastest-growing federal disability category in that year, up nearly 10 percent.
- A commercial 2026 guide cites 38 percent of homeschool students as having special needs, against 14 percent in public special education. That is a different definition and sample from the 25 percent research cut; do not average them.
- Parentally placed homeschool students generally lose an individual right to a public-school IEP. Districts still owe a “proportionate share” of federal special-education funds and a Child Find evaluation duty.
- England’s autumn 2025 home-education census found 16 percent of those children on special-needs support and 7 percent with an education, health and care plan.
- Children and young people with those English plans who were recorded as home-educated numbered 7,155 in January 2025, up from 5,770 in January 2024, a 24 percent rise.
Accommodations for Neurodiversity, ADHD, and Special Care Needs
- Mental health was the reason attached to 16 percent of England’s autumn 2025 home-educated children, ahead of “philosophical or preferential” at 12 percent.
- A 2024 English children’s commissioner estimate put special educational needs among about one quarter of children leaving school for home education.
- Across the 2024–25 English school year, 175,900 children were home-educated at some point, up from 153,300 the year before. That flow includes mid-year exits that a single census day misses.
- Florida opened a 2023 path to an IEP-style evaluation for children who never attended public school, which feeds the state’s unique-abilities scholarship track.
- Ohio’s autism scholarship and Jon Peterson special-needs scholarship exist as separate voucher doors; the Peterson program has been capped at 5 percent of special-needs children statewide when demand exceeds slots.
- Arkansas’s education-freedom design lets homeschool families tap disability services from accredited practitioners starting in 2025–26, using a share of the district formula.
- Therapies bought with an education-savings account are program purchases. They are not the same legal object as a district-delivered IEP service.
- ADHD, autism, and anxiety appear in parent interviews as reasons to leave a classroom. National U.S. homeschool files still rarely publish those diagnoses as separate official counts.
Homeschooling Outside the United States
- England recorded 126,000 registered home-educated children on autumn 2025 census day, about 1.5 percent of children aged 5–16, up from 111,700 in autumn 2024 (13 percent).
- During the whole 2024–25 English year, 78,000 children started home education and 28,100 returned to school.
- New Zealand counted 11,010 homeschool students on 1 July 2025 in 6,518 families, 1.3 percent of school enrollments, the highest official total in that series.
- New Zealand’s year to 1 July 2025 saw 2,025 entries and 1,772 exits, a net gain of 253.
- Of New Zealand’s 2025 homeschoolers, 61.7 percent were age 12 or under, 75.1 percent had been home-educated fewer than five years, and 3.7 percent had been home-educated 10 years or more.
- Canada’s 2022–23 elementary-secondary file put homeschooling at 0.9 percent of enrollments, with public schools at 91.3 percent and private schools at 7.7 percent.
- An older compilation still cited in 2024 international reviews used about 50,000 homeschoolers in Canada and 30,000 in Australia. Those are not 2025 ministry headcounts.
- Spain’s 2026 school-start reporting put home education above 4,000 children, with no official national register and a legal status parents describe as alegal rather than licensed.
Global Participation Rates and Legal Frameworks Abroad
- Legal roundups in 2026 group countries into permissive (United States, United Kingdom, Ireland, Australia, New Zealand, most of Canada), restricted (France after the 2021 law, Quebec, several Australian states with visits), and effectively banned (Germany, Sweden).
- Germany enforces in-person Schulpflicht. The European Court of Human Rights upheld that model in 2006. Rare medical exceptions are not a general homeschool route.
- France moved from a declaration system to prior authorization. Pedagogical-project approvals are the usual remaining door.
- Australia requires registration in all eight states and territories. Queensland is the light-touch end; New South Wales, Western Australia, South Australia, and the Northern Territory add visits or syllabus alignment.
- Every Canadian province and territory allows homeschooling. Quebec is the heavy-regulation province in most legal guides.
- The Children’s Wellbeing and Schools Act in the United Kingdom received royal assent on 29 April 2026 and creates a local-authority register of children not in school, with staggered implementation.
- South Africa’s 2024 basic-education amendment tightened home-education rules inside a system that still names home education as legal.
- “Legal in half the world’s countries” is a 2026 legal-guide summary, not a United Nations enrollment table. There is no single global homeschool census.
AI Tools and Personalized EdTech in Modern Homeschooling
- A 2024 survey compilation circulated in homeschool market notes put weekly generative-AI use at about 40 percent of homeschool households, up from single digits in 2022. That is not a federal series.
- A 2026 child-media census found 86 percent of U.S. children ages 9–17 had used AI in some form, and 24 percent did so daily. That file is all children, not a homeschool subsample.
- Among AI-using children in that census, 89 percent used it for fun or entertainment and 85 percent for school or homework.
- Age cuts in the same census: 81 percent of 9- to 12-year-olds, 89 percent of 13- to 15-year-olds, and 92 percent of 16- to 17-year-olds had used AI.
- September 2026 reporting from the San Francisco Bay Area described high-income parents running AI-assisted home programs, including founders using software agents with four children, as a visible but uncounted slice of California’s shift away from district seats.
- A China study of more than 25,000 secondary students found homework time falling from about 64 minutes to 45 minutes after generative-AI adoption, with homework marks up and later exam scores down.
- High-stakes exam penalties in that study reached about 24 percent of the baseline mean on high-school entrance exams and 18 percent on college entrance exams once the effect matured.
- More than 70 percent of parents and teachers in a 2025 U.S. concern survey said they worried that student AI use could weaken academic skills. Worry is not a homeschool-specific usage rate.
- Curriculum-market estimates of $4.3 billion to $5.5 billion in 2024 with a 7 to 9 percent projected compound rate through 2030 appear in industry notes. Treat them as vendor-side sizing, not household survey spend.
Recent Developments
- England’s autumn 2025 home-education snapshot and the April 2026 register law are the largest official foreign-system changes in this cycle.
- A U.S. university homeschool research team released a winter 2025 parent survey in April 2026 and scheduled an adult wave for spring 2026 and a student wave for summer 2026.
- The first U.S. nationwide homeschool achievement study in 15 years cleared peer review in 2026. Score means from that paper belong in the achievement file, not in an enrollment total.
- Texas opened Education Freedom Accounts for 2026–27 with a smaller homeschool award than the private-school award, which will move some families across legal categories mid-year.
- Idaho’s 2026 diploma-recognition statute and Tennessee’s assessment-option statute changed paperwork after families had already filed under the old rules.
- Bay Area AI-homeschool coverage in September 2026 is a reporting cluster, not a state enrollment series.
- Spain’s 2026 visibility spike around 4,000 home-educated children did not create a national register.
- New Zealand’s July 2025 count set a record and still represented 1.3 percent of enrollments, a reminder that “record” and “large share” are different claims.
Legislative Shifts and Modern Policy Debates
- School-choice fights in 2025–26 clustered on who may spend public money at home, not on whether homeschooling is legal. It already is legal in every U.S. state.
- Universal-eligibility accounts in a handful of states put receipt and testing rules on families who used to operate only under the homeschool chapter.
- Homeschool-inclusive awards are often a fraction of the private-school award in the same statute, which is a price signal, not a population count.
- England’s new register is the main 2026 democratic-country move toward listing children educated outside school. Implementation dates are staggered by local authority.
- France’s authorization regime and Germany’s attendance mandate are the two European poles U.S. memos still cite when a state bill proposes more notice.
- Child-protection arguments and parental-liberty arguments now share hearing rooms with budget arguments about ESA overruns. Those are three debates, not one.
- No U.S. state in the last decade has been recoded into a stricter homeschool-regulation tier in the legal trackers that publish tiers. Several loosened notice or assessment rules in 2026.
- Pending 2026 choice bills in large states will change funded status faster than they change the underlying homeschool statute.
- Data fights remain live: household pulse, state registration, and the aging federal parent survey still disagree on the U.S. share, and statutes that fund homeschoolers will make that disagreement more expensive to ignore.
Editor’s Choice
- For a current U.S. share, do not average the 2022–23 federal parent-survey 3.4 percent with later pulse and state-file readings near 6 percent. They are different instruments.
- If the memo needs a 2024–25 stock number, the blended estimate is 3.408 million students (6.262 percent), range 3.067 million to 3.749 million. Label the range.
- Full-time virtual school was 2.5 percent of students in 2022–23. Folding it into homeschool without saying so moves the share by a couple of points with no building change.
- Pulse weeks in 2023–24 ran from about 5.20 percent to 6.91 percent before averaging to 5.92 percent. A single week is not a school-year rate.
- Only 22 percent of homeschool parents in the winter 2025 parent survey said they had public-fund access; 68 percent said they use or would use it.
- A 2024 family-spend poll put cash outlays at $1,295 (elementary) and $1,636 (secondary) against public current spending near $18,614 per pupil. Those are not the same basket of costs.
- Texas’s 2026–27 homeschool award is $2,000; the participating private-school award is $10,474. The gap decides which legal box the child enters.
- Arizona’s ESA roll hit 92,362 on September 15, 2025, from 77,496 a year earlier, with a 57 percent switcher rate from other public options.
- Volunteer test samples in 2026 sat at the 75th to 79th percentile. They are not a random national homeschool exam.
- Adult bachelor’s rates in the 2023 duration split were 45 percent (short-term) versus 27 percent (long-term). Years at home change the adult file.
- First-choice homeschoolers were 16 percent students with disabilities; second-choice homeschoolers were 36 percent. The reason for leaving school is the split.
- England’s registered home-educated count rose 13 percent in one year, to 126,000 in autumn 2025, and Parliament added a children-not-in-school register in April 2026.
- Ten U.S. jurisdictions still require no notice. An ESA contract in the same country can demand receipts and tests the homeschool statute does not.
- Weekly generative-AI use was about 40 percent of homeschool households in a 2024 compilation, against 86 percent of all U.S. children 9–17 who had used AI by 2026. Those are not the same population.
Frequently Asked Questions
A 2026 synthesis of 23 state files plus household-pulse data estimated 3.408 million homeschool students, or 6.262 percent of school-age children (range 3.067 million to 3.749 million). A Census pulse cut for the same year put the share at 6.530 percent.
The 2022–23 federal parent survey classified 3.4 percent of students ages 5–17 as homeschooled, about 1.76 million children, up from 2.8 percent in 2018–19. Full-time virtual school that parents did not label as homeschool added another 1.8 percent.
Among states that publish rolls, participation rose an average of 4.9 percent in 2024–25, more than double the pre-pandemic pace of about 2 percent. Eighty percent of those reporting states posted an increase, and 36 percent set an all-time high.
A 2024 poll of more than 4,000 families put cash outlays at $1,295 per elementary student and $1,636 per middle- or high-school student. Public current spending in a 2025 compilation sat near $18,853 per pupil.
A 2026 nationwide test-score sample of 1,149 students posted mean percentiles of 75 to 79 across five subjects, against a norm-group midpoint of 50. After income and race controls, weighted means were 74 to 82.
Summing it Up!
The planning problem at the end of this file is not whether homeschooling exists at scale. It does. The problem is which ledger you are holding when someone asks for “the” number. Enrollment shares from a 2022–23 parent survey will not reconcile with a 2024–25 pulse cut, and neither one is a college-outcomes table split by years spent at home.
Cash spent on curriculum is not public current spending per pupil, and an education-savings-account award can move a child out of the independent-homeschool statute without moving the desk out of the kitchen.
Foreign counts make the same point in another key: England now publishes a census and a register, Germany still treats attendance as the rule, and neither system is a scaled-down United States.
Write the year on the figure, name the unit, and leave the disagreeing cut visible. That is the whole method.
Sources and editing
This article cites state departments of education, the National Center for Education Statistics (NCES), U.S. Census Bureau Household Pulse surveys, and peer-reviewed research.
We may use AI tools to sort tables or improve wording. A human reviewer checks the numbers, citations, and claims before publication.
