
Homeschooling and virtual schooling now function as permanent operational alternatives within the American educational system. This structural shift alters state legislative appropriations, where public school districts lose average daily attendance funding whenever a pupil withdraws to attend a virtual charter or an independent home study program.
At the same time, educational software publishers design adaptive curricula specifically engineered for self-paced remote delivery. Differentiating between parent-led home instruction and state-managed virtual schooling provides journalists, analysts, and families with verifiable baseline data rather than speculative estimates.
Editor’s Choice
- Primary Parental Motivation: Data from Pew Research Center shows 83% of homeschooling parents cite the school environment, specifically physical safety, illicit substances, and negative peer pressure, as a primary reason for leaving traditional classrooms.
- Standardized Learning Losses in Cyber Charters: Research published in MDPI Education Sciences reports that full-time virtual charter school students experience an average learning loss equivalent to 180 days in mathematics and 72 days in reading per academic year compared to matched peers in brick-and-mortar facilities.
- Institutional Performance Ratings: Only 42.8% of virtual schools achieved acceptable state performance ratings during the 2019–20 school year, representing a 5.7 percentage point decline from 2017–18 audits documented by the National Education Policy Center.
- Instructional Dissatisfaction: 72% of homeschooling parents report direct dissatisfaction with academic instruction at traditional schools, placing academic quality just behind moral instruction (75%) as a driving factor.
- Completion Disparities: Full-time cyber high schools report an average on-time graduation rate of 57.3%, lagging behind the national public high school completion average of 87%.
- Household Financial Burden: Parents educating children through independent homeschooling spend an average out-of-pocket sum of $600 to $1,200 per child annually on books and materials, whereas families attending public virtual schools receive state-funded tuition and hardware at zero direct cost.
- Post-Pandemic Floor: The combined share of K–12 students receiving home-based education, either through independent homeschooling or virtual schooling, stands at 5.2% nationwide, establishing a permanent baseline above the 3.7% combined total recorded in 2018–19.
- Reported Family Satisfaction: Federal survey data reveals that 78% of homeschooling parents describe themselves as very satisfied with their instructional arrangement, compared to 63% of parents across all school types nationwide.
General Overview: Homeschooling vs. Virtual Schooling
- Legal Administration: Homeschooling places 100% of administrative and legal responsibility on the parent or legal guardian, whereas virtual schooling retains the administrative authority of a local school district, charter authorizer, or private school board.
- Public Versus Private Cyber Enrollment: Public tuition-free charter and district programs educate 88% of all virtual school students in the United States, while tuition-charging private virtual academies account for the remaining 12%.
- Direct Instruction Hours: Certified teachers deliver 20 to 30 hours of synchronous and asynchronous lessons weekly in virtual schools, whereas parents provide an average of 15 to 20 hours of direct academic direction per week in homeschool environments.
- Standards Alignment: Virtual public schools must align 100% of course offerings with state grade-level learning standards, while 11 states require no curriculum approval or subject-matter verification for independent homeschoolers.
- Credential Issuance: Virtual schools issue state-certified diplomas accompanied by accredited transcripts, whereas homeschool graduates enter the workforce or higher education using parent-signed diplomas and parent-compiled academic portfolios.
- Special Education Entitlements: Students with an Individualized Education Program (IEP) enrolled in public virtual schools maintain statutory rights under the Individuals with Disabilities Education Act, while students exiting public education for private homeschooling waive their entitlement to direct district-delivered services in most jurisdictions.
- Attendance Verification: Virtual schools audit student engagement through automated login logs, keystroke trackers, and synchronous session sign-ins, whereas homeschool families record instruction through manual attendance logs or periodic state affidavits.
- Accreditation Mandates: Regional accreditation bodies accredit over 90% of established virtual schools, while independent homeschools operate outside institutional accreditation frameworks.
- Accountability Testing Participation: Public virtual schools maintain an average 95% student participation rate on state-administered assessments to retain public charter authorization, while only 17 states require homeschooled students to submit test scores or formal academic evaluations.
Enrollment Trends and National Growth Statistics
- Pre-Pandemic Baseline (2018–19): National Center for Education Statistics data established that 1.5 million students (2.8% of the K–12 population) were homeschooled, while 450,000 students (0.86%) attended full-time virtual schools prior to 2020.
- Pandemic Disruption Peak: US Census Bureau Household Pulse Survey samples recorded that 11.1% of American households with school-age children reported homeschooling in fall 2020, though that survey included temporary remote crisis schooling.
- Post-Pandemic Stabilization: Federal figures documented a stabilization at 1.8 million homeschooled students (3.4%) and 950,000 full-time virtual school students (1.8%) by spring 2023.
- Measurement Differences: The National Home Education Research Institute claims 3.1 million to 3.7 million students in home education for the 2024–2026 period, counting part-time home educators and students using state education savings accounts, whereas NCES excludes pupils enrolled in physical or virtual schools for more than 25 hours per week.
- Cyber Charter Expansion: Enrollment in full-time virtual charter schools expanded by 84% between 2019 and 2024, holding steady despite the full reopening of physical school buildings nationwide.
- Commercial Network Scale: Stride Inc. reported serving over 220,000 full-time equivalent students across its managed public and private charter network during the 2023–24 academic year.
- Statewide Virtual Scale: Florida Virtual School delivered instruction to more than 240,000 individual students across full-time and supplemental individual course enrollments in the 2023–24 school year, maintaining its standing as the largest state-run virtual provider.
- Private Virtual Growth: Independent private virtual academies reported a 27% enrollment increase between 2021 and 2025, supported by suburban families using state-funded Education Savings Account vouchers to offset tuition.
- Rural Adoption: Students in rural and small-town school districts represent 31% of the total virtual school student body, compared to 22% of total traditional public school enrollments.
Student Demographics and Geographic Distribution
- Racial Composition in Homeschooling: Federal survey data reports that 62% of homeschooled students are White, 18% are Hispanic, 9% are Black, and 5% are Asian.
- Racial Composition in Virtual Schools: Research from the National Education Policy Center indicates full-time virtual schools enroll 64% White students, 15% Hispanic students, 12% Black students, and 3% Asian students.
- Household Income Stratification: Among homeschooled students, 48% live in households earning between $50,000 and $100,000 annually, 29% live in households earning over $100,000, and 23% live in households earning under $50,000.
- Economically Disadvantaged Representation: 49% of students enrolled in full-time virtual charter schools qualify for federal free or reduced-price lunch programs, slightly below the 52% national average across traditional public schools.
- Regional Distribution: The American South accounts for 41% of all homeschooled children, followed by the West at 25%, the Midwest at 21%, and the Northeast at 13%.
- State Clustering in Virtual Charters: Five states, specifically Ohio, Pennsylvania, California, Texas, and Arizona, account for 52% of all virtual charter school enrollments in the nation.
- Parental Education Levels: 42% of homeschooling parents hold a bachelor’s degree or higher, matching the 41% baseline recorded among parents of traditional public school students.
- Grade-Level Distribution in Homeschools: Elementary students in grades K–5 make up 46% of all homeschooled children, middle schoolers in grades 6–8 account for 27%, and high schoolers in grades 9–12 represent 27%.
- High School Weight in Virtual Schools: High school students comprise 48% of total virtual school enrollments, reflecting higher demand for online credit recovery and alternative graduation tracks.
Reasons for Choosing Homeschooling vs. Virtual Schooling
- School Environment Concerns: 83% of homeschooling parents cite concerns regarding the school environment, including safety, drugs, and negative peer pressure, compared to 68% of parents who choose full-time virtual schooling.
- Moral Instruction Priorities: Data shows 75% of homeschooling parents select home instruction to provide moral values, an incentive cited by only 24% of families enrolling in secular public virtual schools.
- Academic Dissatisfaction: 72% of homeschooling parents express dissatisfaction with the academic instruction at traditional schools, while 64% of virtual school parents cite a desire for self-paced coursework as their primary reason.
- Family Unity: 72% of homeschooling parents designate the desire to emphasize family life together as a central factor, compared to 39% of virtual school parents who focus on keeping instructional oversight within the home.
- Religious Values: 53% of homeschooling families identify religious instruction as a reason for their decision; public virtual schools cannot offer sectarian coursework due to constitutional separation requirements.
- Chronic Health Conditions: 15% of homeschooling parents report their child has a physical or mental health problem lasting six months or longer, compared to 28% of virtual school parents who cite medical conditions requiring asynchronous schedule flexibility.
- Nontraditional Pedagogical Methods: 50% of homeschool parents choose the model to apply distinct educational approaches like Charlotte Mason, Montessori, or classical curricula, whereas virtual school families follow traditional scope-and-sequence curricula online.
- Special Education Deficits: 21% of homeschool parents report leaving physical facilities because the school could not or would not meet their child’s special needs, compared to 26% of virtual school parents.
- Bullying Avoidance: 34% of parents choosing virtual schooling report their child experienced acute bullying or social harassment in a physical school immediately prior to enrollment.
Academic Achievement and Standardized Testing Outcomes
- Homeschool Percentile Rank Assertions: Self-selected testing samples compiled by the National Home Education Research Institute show homeschooled students scoring between the 80th and 90th percentile across reading, language, and math on norm-referenced exams like the Iowa Assessments.
- Sample Selection Caveats: Methodological reviews from policy analysts highlight that homeschool test scores reflect voluntary submissions from wealthier, highly educated families rather than a controlled, mandatory national testing cohort.
- Virtual School Math Deficits: Longitudinal studies published in MDPI Education Sciences show students in cyber charter schools lose an average of 0.44 standard deviations in mathematics achievement, equivalent to losing 180 days of learning relative to classroom-based peers.
- Virtual School Reading Losses: Research on virtual charter students documents an average loss of 0.25 standard deviations in reading performance, representing approximately 72 days of lost instruction per school year.
- State Assessment Proficiency in Cyber Charters: In Pennsylvania, only 22.4% of cyber charter school students scored proficient or advanced on state math exams during the 2023–24 school year, compared to 48.3% of students in brick-and-mortar public schools statewide.
- Supplemental Course Outcomes: Full-time students at Florida Virtual School recorded a 54% proficiency rate on statewide end-of-course Algebra 1 exams in 2024, slightly outpacing the 51% proficiency average among traditional Florida school districts.
- Classic Learning Test Performance: High school homeschooled students taking the Classic Learning Test achieved average composite scores 5 percentile points above private school examinees and 15 percentile points above public school test-takers between 2022 and 2024.
- College Entrance Exam Baselines: College Board data reveals homeschooled high school seniors who took the SAT in 2023 earned a mean score of 1110, outperforming the national public school average of 1028, though fewer than 15% of all homeschool graduates sat for the test.
- Advanced Placement Pass Rates: Virtual school students sitting for Advanced Placement exams earned a passing score of 3 or higher on 58% of tests administered in 2024, closely tracking the national public school pass rate of 60.2%.
Annual Cost and Resource Expenditure Comparison
- Homeschool Household Expenditures: Independent homeschooling families spend an out-of-pocket average between $600 and $1,800 per child each year on physical textbooks, software subscriptions, and laboratory kits, according to survey estimates from the Home School Legal Defense Association.
- Public Virtual School Tuition Baselines: Families enrolled in public cyber charter schools pay $0 in direct tuition, while state departments of education distribute between $6,000 and $10,500 per pupil in foundation formula funds directly to the operating virtual school.
- Hardware and Broadband Allocations: Approximately 84% of full-time virtual charter schools loan laptops or tablets directly to enrolled pupils at zero charge, and 62% provide monthly broadband stipends ranging from $20 to $50 per household.
- Private Virtual School Price Ranges: Independent private virtual academies charge annual tuition spanning $1,500 to $7,500 per student for self-paced platforms, whereas live instructor-led preparatory academies reach up to $15,000 annually.
- Education Savings Account Distribution: Universal voucher and ESA programs across states like Arizona, Florida, and Utah distribute between $7,000 and $9,000 per student annually, which participating home-educating families apply toward approved curricular vendors and testing services.
- Extracurricular Out-of-Pocket Outlays: Homeschool households invest an incremental $500 to $2,500 annually per child for community sports leagues, instrumental music lessons, and cooperative laboratory fees.
- Household Wage Forfeiture: Economic models show that full-time, parent-delivered homeschooling typically requires one caregiver to forego full-time employment, resulting in an estimated indirect household cost of $45,000 to $75,000 in missed annual median earnings.
- Therapy and Assessment Costs: Families of children with specialized learning requirements pay between $1,200 and $6,000 annually for private speech, behavioral, and occupational therapy after declining public district service agreements.
Curriculum Flexibility and Instructional Autonomy
- Complete Methodological Freedom: Parents directing home instruction control 100% of subject selection and pacing across 39 states that impose minimal or moderate curricular review guidelines.
- Mandatory State Scope and Sequence: Public virtual school students must complete 100% of state-mandated standard core course sequences, logging defined instructional hours in English, mathematics, science, and social studies.
- Commercial Curriculum Adoption in Homeschools: Industry estimates report that 68% of homeschool families purchase modular pre-packaged curricula (such as Saxon Math or Singapore Math), combining distinct publishers rather than relying on a single boxed program.
- Proprietary Learning Management Systems: Virtual charter schools rely heavily on centralized enterprise software, with 78% of virtual charter networks utilizing proprietary platforms provided by management corporations like Stride or Pearson.
- Pacing Customization in Home Instruction: National survey data indicates 74% of homeschooling parents adjust daily and weekly instructional schedules based on child comprehension rather than rigid academic quarter deadlines.
- Synchronous Attendance Constraints: Students attending full-time public virtual schools spend an average of 12 to 20 hours per week in mandatory synchronous video classroom sessions to satisfy state statutory attendance rules.
- Secular Curricular Mandates: Public cyber schools maintain strict statutory secular compliance across 100% of funded instructional content, while roughly 65% of commercially sold independent homeschool curricula incorporate religious or moral frameworks.
- Credit Transfer Risks: Only 44% of traditional public school districts accept parent-issued homeschool high school credits upon re-enrollment, whereas accredited virtual school transcripts transfer into traditional schools at a rate exceeding 95%.
Parental Time Commitment and Instructional Demands
- Elementary Instructional Hours: Parents homeschooling elementary-aged children (grades K–5) dedicate an average of 3 to 5 hours daily to direct instruction, lesson grading, and activity supervision.
- High School Advisory Shifts: Homeschool parents of students in grades 9–12 average 1 to 2 hours of direct teaching daily, transitioning from primary lecturers into academic facilitators as teenagers work independently.
- Learning Coach Demands in Virtual Charters: Virtual charter schools require parents to serve as unpaid “learning coaches,” demanding 4 to 6 hours daily for kindergarten through third grade and 2 to 3 hours daily for middle schoolers.
- Workforce Balancing Realities: Federal survey data reveals that in 71% of homeschooling households, at least one parent remains completely out of the full-time labor force to manage daily educational requirements.
- Dual-Working Homeschool Households: Approximately 24% of homeschooling families maintain two working parents, relying on staggered evening work shifts, telework flexibility, and shared weekend schooling.
- Preparation and Lesson Planning: Independent homeschool parents invest an additional 5 to 8 hours each weekend researching materials, writing lesson plans, and organizing laboratory experiments.
- Attendance Auditing Burden: Parents of virtual school pupils spend approximately 30 to 45 minutes daily logging into administrative portals, signing student attendance affidavits, and verifying assignment upload timestamps.
- Reported Caregiver Strain: Parent surveys indicate that 43% of parents serving as virtual school learning coaches report moderate to severe instructional fatigue within their first 18 months of enrollment.
Teacher Qualifications and Support Systems Comparison
- State Teacher Certification Disparity: Public virtual charter schools employ state-certified educators for 100% of core academic classes, while 0 states require parents to hold a teaching certificate to homeschool their children.
- Parental College Attainment: Census Bureau and NCES statistics indicate that 42% of homeschooling parents hold a bachelor’s degree or higher, compared to 100% of instructional staff in public cyber academies.
- Student-to-Teacher Ratios: Research from the National Education Policy Center shows full-time virtual schools maintain an average student-teacher ratio of 27:1, with some commercial cyber operators reporting ratios exceeding 45:1.
- Traditional Public School Staffing Comparison: The national average student-teacher ratio in physical public schools stands at 16:1, representing nearly half the pupil load handled by cyber school educators.
- Individualized Feedback Latency: Middle and high school virtual charter students wait an average of 24 to 48 hours for graded feedback on written assessments from remote teaching teams.
- Teacher Turnover Rates: Full-time virtual charter schools experience an annual teacher turnover rate of roughly 28% to 35%, outpacing the 14% to 16% turnover rate documented across traditional public school districts.
- Co-op Specialist Utilization: Approximately 52% of homeschool students participate in weekly educational cooperatives, where they receive instruction from specialized parent tutors or hired subject-matter experts.
- Caseload Constraints on Support Staff: Guidance counselors in virtual high school environments carry caseloads averaging 400 to 600 students, compared to the American School Counselor Association recommended threshold of 250:1.
- Community Activity Participation: Survey data compiled by the National Home Education Research Institute shows that 87% of homeschooled students engage regularly in outside sports leagues, community scouting groups, fine arts programs, or volunteer projects.
- Cooperative Network Membership: Over 60% of homeschooling families join local weekly cooperatives, participating in group science laboratories, theatrical productions, and foreign language instruction.
- Interscholastic Athletics Access (“Tim Tebow Laws”): Currently, 34 states enforce statutory protections allowing homeschooled students to try out for interscholastic sports teams within their local resident public school districts.
- Virtual School Extracurricular Limitations: Only 19% of public virtual charter schools offer competitive interscholastic sports teams, relying instead on student-run virtual clubs and supervised regional day meetups.
- Daily In-Person Peer Interaction: Homeschooled pupils spend an average of 8 to 12 hours per week interacting with multi-age peers in non-classroom settings, whereas virtual charter students log fewer than 4 hours weekly in structured offline peer environments.
- Peer Group Size Differences: Virtual school students interact with larger peer cohorts (classes of 25 to 50 peers during online webinars), but only 22% report developing close personal friendships with online classmates outside school hours.
- Civic and Volunteer Hours: High school homeschooled students complete an average of 48 hours of voluntary community service annually, exceeding the national high school average of 31 hours recorded in federal youth surveys.
- Parent-Managed Social Calendars: Sociological surveys note that 91% of homeschooling parents actively organize their child’s social calendar, compared to 48% of parents with children in full-time virtual schools.
Mental Health, Well-being, and School Safety Data
- Bullying Reduction Outcomes: Surveys of families withdrawing from physical facilities show that 82% of students who transferred to home instruction or virtual schools reported a decrease in daily anxiety stemming from peer bullying.
- Daily Screen Time Exposure: Full-time virtual school students average 5.5 to 7.5 hours of daily instructional screen time, raising parental concerns about eye fatigue in 69% of surveyed households.
- Homeschool Screen Time Baselines: Elementary homeschoolers average 1.5 to 2.5 hours of daily educational screen time, relying primarily on print workbooks, tactile manipulatives, and physical literature.
- Sleep Schedule Regularity: Adolescent students in both virtual schools and homeschool environments sleep an average of 8.4 hours per night, compared to 7.1 hours reported by high schoolers attending brick-and-mortar campuses with early morning start times.
- Youth Social Isolation Indicators: Mental health tracking surveys indicate 26% of full-time virtual school adolescents express feelings of acute social isolation during the winter term, compared to 14% of homeschooled teens active in weekly regional co-ops.
- Clinical Health Triggers for Enrollment: Approximately 15% of homeschooling families and 28% of virtual charter families cite long-term pediatric chronic illnesses (such as autoimmune disorders, chronic fatigue, or severe mobility issues) as the primary catalyst for leaving physical campuses.
- Reduction in Behavioral Discipline Events: Transitioning out of traditional schools eliminates 100% of formal disciplinary suspensions, detentions, and truancy notices for participating students.
- Parental Perception of Emotional Safety: 92% of parents in both alternative tracks report their children experience greater psychological well-being at home compared to their prior experiences in traditional school classrooms.
Statistics on Neurodivergent and Special Education Needs
- Special Education Prevalence in Homeschooling: Industry studies indicate that approximately 38% of homeschooled children have identified neurodivergent conditions or special educational needs (such as ADHD, autism spectrum disorder, or dyslexia), nearly triple the 15% baseline served under IDEA in public schools.
- Formal Virtual School IEP Enrollment: Federal reporting shows that 12% to 15% of pupils enrolled in public virtual charter schools receive formal accommodations under an Individualized Education Program (IEP).
- Child Find Evaluation Rights: Federal law requires public school districts to evaluate homeschooled children for suspected learning disabilities at zero charge under “Child Find” provisions, yet fewer than 18% of homeschool families utilize this service.
- Specialized Service Delivery Gaps: Only 31% of students with an IEP in virtual charter schools receive direct, teletherapy-delivered occupational or physical therapy that matches the frequency outlined in their original physical district plans.
- Parental Special Education Motivation: In Pew Research Center surveys, 21% of homeschooling parents reported choosing home education explicitly because their previous school could not or would not accommodate their child’s specialized educational requirements.
- Sensory Overload Mitigation: Parent evaluations report a 74% reduction in sensory-induced emotional meltdowns among autistic students after switching from crowded physical classrooms to home-based virtual or self-paced learning.
- Private Therapy Burden: 64% of special-needs homeschooling households pay for private, clinical interventions entirely out-of-pocket, spending a median of $3,200 annually.
- ADHD Task Pacing Flexibility: Studies assessing neurodivergent student pacing show that ADHD students in self-directed homeschool setups complete required core work in 40% less time than in structured brick-and-mortar or synchronous virtual school schedules.
Technology Infrastructure and Digital Tool Adoption Rates
- High-Speed Broadband Access: 98% of virtual school households maintain active high-speed broadband connections, compared to 92% of independent homeschooling households, according to federal telecommunications connectivity surveys.
- Learning Management System Standardization: Over 75% of full-time virtual charter schools deploy centralized enterprise platforms such as Canvas or Blackboard, alongside proprietary management systems developed by Stride and Pearson.
- Artificial Intelligence Curricular Integration: A 2025–2026 survey by EdChoice reports that 38% of homeschooling parents regularly use generative AI tools to build lesson outlines, generate reading comprehension prompts, and explain STEM concepts.
- Hardware Provisioning Models: Approximately 84% of virtual charter schools loan district-owned laptops or tablets directly to enrolled students, whereas 94% of homeschooling students utilize family-purchased hardware.
- Digital Software Subscriptions: Homeschool households spend an annual average of $350 on specialized educational software applications, purchasing supplementary math and phonics licenses from providers like Time4Learning and Beast Academy.
- Instructional Screen Time Differences: Full-time virtual charter pupils log between 25 and 35 hours weekly of monitored device usage, while independent homeschool students average 8 to 14 hours weekly, balancing screen work with physical texts.
- Assistive Digital Technology: 29% of neurodivergent homeschoolers utilize speech-to-text programs, text-to-speech readers, or specialized dyslexia fonts, compared to 19% of special education students in traditional public classrooms.
- Technical Disruption Realities: Virtual charter school students lose an average of 4.2 instructional days per academic year because of residential internet outages, hardware failures, or scheduled learning management platform updates.
State-by-State Regulatory and Accreditation Data
- Statutory Oversight Tiers: The Home School Legal Defense Association categorizes state homeschool statutes into four administrative tiers: 11 states require no official notice, 14 states require notification only, 19 states mandate low-to-moderate recordkeeping, and 6 states enforce high regulatory oversight.
- High-Oversight State Mandates: Six states, specifically New York, Pennsylvania, Massachusetts, Vermont, Rhode Island, and North Dakota, require parents to submit annual study plans, quarterly grade reports, and annual standardized test scores or certified teacher portfolio audits.
- Zero-Notice Jurisdictions: Eleven states, including Texas, Idaho, Oklahoma, and New Jersey, require zero annual state registration, attendance verification, or standardized assessment submissions from parent educators.
- Virtual Charter Authorizing Authority: 38 states authorize statewide virtual charter schools, concentrating regulatory governance under state boards of education, independent charter commissions, or local educational agencies.
- Automated Attendance Compliance: Virtual charter schools in states like Ohio and California audit student attendance through minute-by-minute system logins and keystroke tracking, verifying compliance with statutory thresholds of 900 to 1,080 annual instructional hours.
- Institutional Accreditation Rates: Over 92% of full-time virtual charter schools hold formal accreditation from regional agencies such as Cognia or the Middle States Association of Colleges and Schools.
- Teacher Credential Requirements: 100% of public virtual charter schools must employ state-certified educators to oversee coursework, while zero states require parents directing home instruction to hold a teaching license or an advanced degree.
- Compulsory Education Enforcement: State compulsory schooling statutes cover ages 6 through 18, and 17 states subject homeschool families to administrative truancy reviews if formal withdrawal paperwork lapses.
High School Graduation Rates and Post-Secondary Readiness
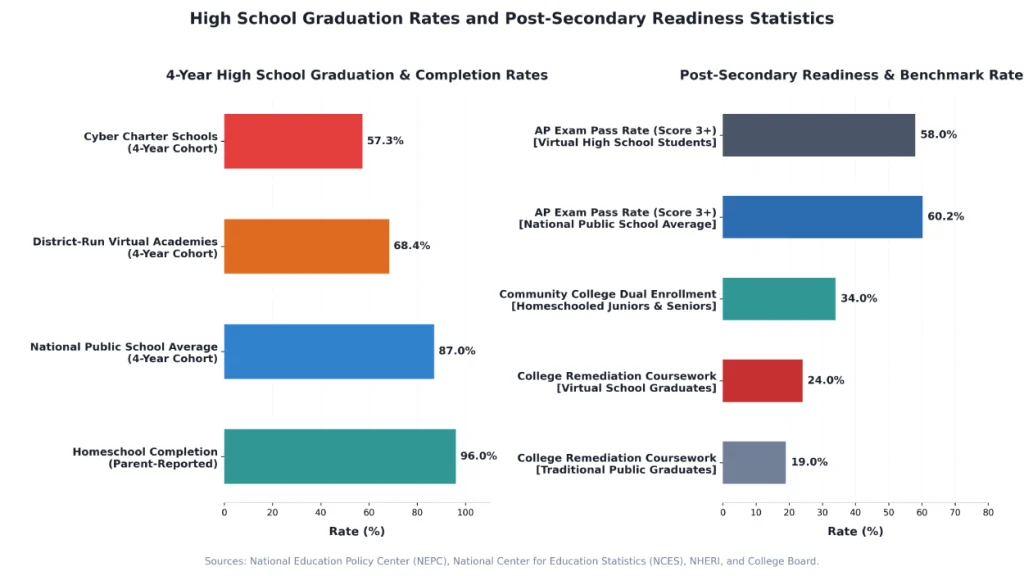
- Cyber Charter Graduation Deficits: Longitudinal analyses by the National Education Policy Center document an average four-year high school graduation rate of 57.3% for full-time virtual charter schools, trailing behind the national public high school average of 87%.
- District-Run Virtual Completion: District-operated virtual academies maintain a higher four-year graduation average of 68.4%, though that rate still lags traditional physical campuses by nearly 19 percentage points.
- Homeschool Completion Metrics: Survey figures from the National Home Education Research Institute report a 96% high school completion rate among long-term homeschoolers, though policy analysts note parent-issued diplomas lack mandatory external state verification.
- Credit Recovery Disparities: 41% of high school students who transfer into full-time virtual schools do so with existing credit deficiencies, heavily weighting cyber senior cohorts toward at-risk graduation timelines.
- ACT Exam Performance: ACT testing records show homeschooled high schoolers achieve an average composite score of 22.8, outpacing the national public school average of 19.5, though test participation remains concentrated among college-bound applicants.
- Advanced Placement Performance: Virtual high school students completed over 110,000 Advanced Placement exams in 2024, earning a qualifying score of 3 or higher on 58% of tests administered.
- Community College Dual Enrollment: 34% of homeschooled high school juniors and seniors enroll in concurrent college coursework, earning transferable college credits prior to high school graduation.
- Post-Secondary Academic Remediation: 24% of virtual high school graduates place into remedial non-credit mathematics or English courses during their freshman college year, compared to 19% of traditional public high school graduates.
Higher Education Matriculation and Career Outcomes
- Immediate College Enrollment Rates: National longitudinal data shows a 64% immediate post-secondary matriculation rate for homeschooled high school graduates, closely matching the 62% national average for public high school graduates.
- University Admissions Protocols: More than 78% of US higher education institutions maintain dedicated homeschool admissions guidelines, evaluating parent reading lists, dual-enrollment grades, and standardized exam percentiles.
- Four-Year College Completion: Undergraduate tracking records show homeschooled students graduate from four-year universities at a 66.7% rate, exceeding the 57.5% national institutional average recorded by the National Center for Education Statistics.
- Undergraduate Academic Performance: Academic studies evaluating university cohorts find homeschooled students maintain an average cumulative first-year GPA of 3.37, compared to 3.08 among public school alumni.
- Adult Entrepreneurship Rates: Sociological evaluations report that 22% of home-educated adults operate their own enterprises or work as independent contractors by age 30, compared to 11% among public school alumni.
- Military Enlistment Classification: The US Department of Defense designates homeschooled graduates with parent-issued diplomas as Tier 1 enlistees, providing them identical enlistment standing to traditional high school diploma holders.
- Career and Technical Certifications: 28% of virtual school alumni earn an industry-recognized technical or vocational credential within two years of high school completion.
- Civic Voting Engagement: Research assessing adult civics participation reveals that 76% of home-educated adults aged 18 to 24 vote in national presidential elections, compared to 42% of age-matched peers nationwide.
Recent Developments
- Universal Education Savings Account Expansion: Between 2023 and 2026, 12 states (including Arizona, Florida, Iowa, West Virginia, and Ohio) implemented or widened universal Education Savings Account programs, providing eligible families up to $8,500 annually for private tuition, virtual courses, or approved homeschool curricula.
- Contraction of District-Run Virtual Academies: Following the exhaustion of federal ESSER pandemic relief funds, traditional public school districts closed 31% of internally operated remote academies, funneling students into centralized statewide cyber charters.
- Legislative Battles Over ESA Accountability: State legislative sessions in 2025 across four states saw contested measures proposing mandatory annual standardized testing for families accepting public ESA vouchers.
- Corporate Management Consolidation: Mergers and acquisitions shifted operational management for 64% of private educational management companies running cyber schools between 2022 and 2025.
- State Financial and Attendance Audits: Fiscal audits conducted in Pennsylvania and California in 2024 revealed that large cyber charter schools accumulated over $1.2 billion in reserve balances while failing to meet state academic growth benchmarks.
- Growth of Hybrid Learning Microschools: Census tracking reports that 18% of homeschooling students now participate in hybrid microschools, attending physical facilities two days each week while completing parent-directed home study on the other three days.
- Supplemental Course Access Laws: Florida statutes updated in 2024 allow registered homeschool students to enroll in up to three Florida Virtual School courses annually funded by state formulas without altering their independent legal status.
- Federal Civil Rights Reviews: The US Department of Education launched administrative inquiries in 2025 examining whether full-time virtual charter schools adequately deliver required language and disability accommodations to federally protected student subgroups.
Future Growth Projections and Parental Satisfaction Trends
- Demographic Plateau in Homeschooling: Long-term projections from the National Center for Education Statistics forecast the homeschool population will stabilize between 3.2% and 3.6% of the national K–12 population through 2030.
- Virtual Charter Expansion Forecast: Financial analysts project full-time virtual charter school enrollments will grow at an annual rate of 3.8% through 2028, sustained by steady demand for personalized schedules and bullying prevention.
- Net Promoter Scores Across School Types: Polling by EdChoice documents a Net Promoter Score of +64 among homeschooling parents regarding their educational choice, compared to +38 for virtual school parents and +18 for traditional public school parents.
- Comparative Academic Satisfaction: 78% of homeschooling parents report being very satisfied with their child’s academic development, compared to 65% of virtual charter parents and 63% of parents in physical public schools.
- Demand for Hybrid Scheduling: National polling shows 46% of parents currently utilizing brick-and-mortar public schools express an interest in hybrid models that blend two days of classroom instruction with three days of remote study.
- Telework Correlation: Econometric modeling shows every 5% increase in permanent adult teleworking jobs correlates with an 0.8% increase in local homeschool and virtual school enrollment.
- Educator Career Transitions: Certified teacher applications for remote virtual school positions increased by 42% between 2023 and 2026, with teachers citing lower classroom management stress despite lower starting compensation.
- Multi-Year Retention Rates: 68% of families who begin homeschooling in kindergarten maintain home education through the end of elementary school, whereas virtual charter schools report an annual pupil attrition rate between 35% and 45%.
Conclusion
The data confirms that homeschooling and virtual schooling are distinct educational paths rather than interchangeable alternatives. While virtual schools provide state-funded access, certified educators, and standard accountability metrics, they face lower completion rates and academic deficits in mathematics. Independent homeschooling delivers higher parent satisfaction and standardized test percentiles among self-selected cohorts, but requires substantial caregiver labor and private financial expenditure. Tracking these statistical differences allows educators, policymakers, and families to evaluate both models based on documented outcomes.
Sources and editing
This article cites state departments of education, the National Center for Education Statistics (NCES), U.S. Census Bureau Household Pulse surveys, and peer-reviewed research.
We may use AI tools to sort tables or improve wording. A human reviewer checks the numbers, citations, and claims before publication.
