
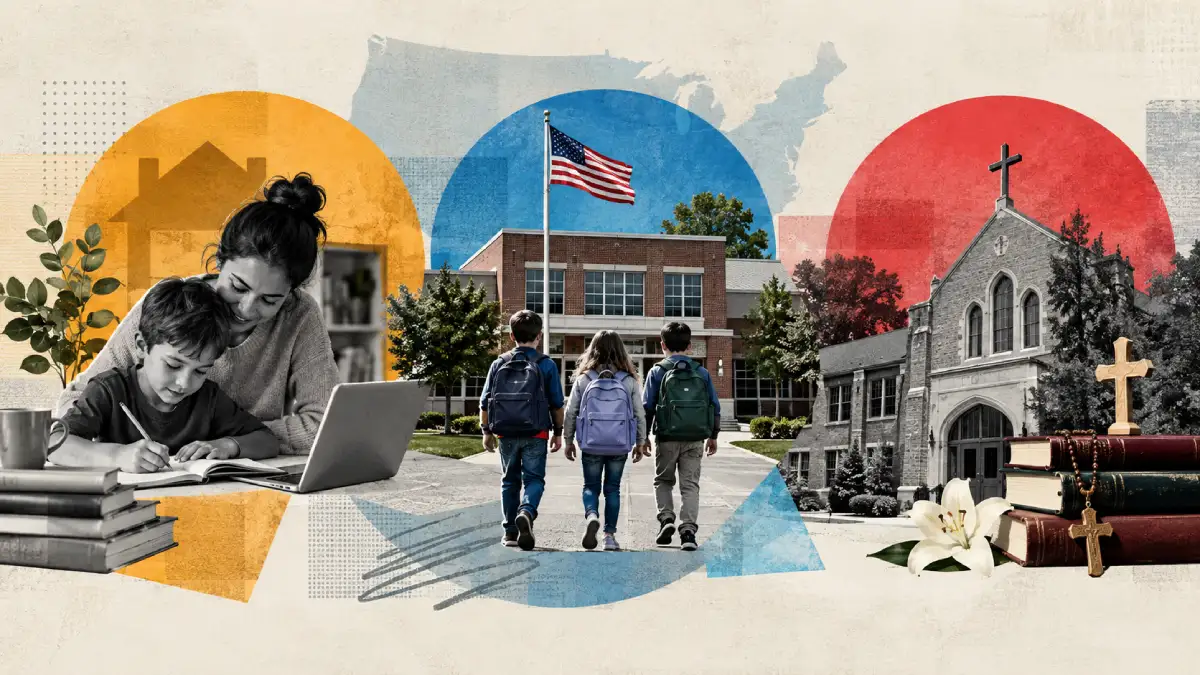
Homeschooling now enrolls more U.S. K-12 students than the entire Catholic school system and sits just behind public charter schools. A diocese planner still has to price empty desks in one parish against a waitlist in another. A charter CFO has to staff a campus that can lose a fall cohort to a co-op or an education savings account. The counts below use 2024-25 and 2025-26 figures first, then state shares, money, and parent motives.
3,784,000 students across 7,800 schools
3,408,000 students (surpassed Catholic in 2020)
1,684,000 students across 5,920 schools
Total students outside traditional district schools
How many students are in homeschool, Catholic, and charter schools in 2024-25 and 2025-26?
Parent-led homeschooling is no longer a rounding error next to brick-and-mortar alternatives. The latest synthesis that blends state registers with a federal household survey puts home-based K-12 students ahead of the entire Catholic system and close to the public charter sector.
- An estimated 3.408 million K-12 students were homeschooled in 2024-25, defined as parent-directed home education and excluding public at-home programs, home-based charters, and private micro-schools.
- That estimate sits inside a ±10% band of 3.067 million to 3.749 million.
- The figure uses a July 1, 2024 school-age population of 54,417,758 as the denominator.
- Catholic PK-12 enrollment was 1,683,506 in 2024-25 across 5,852 schools.
- One year later, Catholic enrollment was 1,674,907 in 5,829 schools for 2025-26.
- Federal Common Core of Data membership shows 3,949,735 public charter students in 2024-25.
- The prior-year federal charter count was 3,851,093 in 2023-24.
- A separate charter-sector tally used in 2025 comparison notes put 2023-24 charter enrollment at 3.784 million, a different cut from the federal file, not a second official census.
- On those 2024-25 comparisons, homeschool enrollment ran at about double Catholic enrollment and a few hundred thousand below the federal charter count.
Headcounts mislead if you ignore the base. Public schools still hold most children. The fight is over the remaining fifth of the age group, and even that slice is measured three ways.
- Homeschooling was 6.262% of the school-age population in the 2024-25 blended estimate.
- The Census Household Pulse cut for late summer 2024 put the split at 83.016% public, 10.453% private, and 6.530% homeschooled.
- Charters are already inside the public total. They were 8.02% of public-school membership in 2024-25.
- A 2026 mixed-vintage sector model assigned 74.0% of students to traditional public schools and 7.2% to charters.
- That same model put homeschooling at 4.8%, lower than the 2024-25 blended homeschool share because the vintages and definitions do not match.
- Federal private-school enrollment was 5,096,365 in 2023-24.
- Catholic students were roughly one-third of that private total in the overlapping years, so “private” is not a Catholic synonym.
- Public membership, charters included, was 49,269,882 in 2024-25 across 99,073 operating public schools.
Alternative K-12 Sector Share (2024-2025)
Proportional distribution of students enrolled outside traditional district public schools.
| Alternative K-12 Sector | Headcount | Share | National Total |
|---|---|---|---|
Public Charter Schools | 3,784,000 | 42.6% | 6.95% |
Independent Homeschooling | 3,408,000 | 38.4% | 6.26% |
Catholic Parochial Schools | 1,684,000 | 19.0% | 3.10% |
How much have the three sectors grown since the pre-pandemic baseline?
The pandemic spike did not fully unwind. When analyzing homeschool enrollment by year, homeschooling fell after the 2020-21 peak, then climbed again in reporting states. Charters added students more slowly. Catholic schools stopped the long slide, then slipped by a few thousand.
- Homeschool enrollment was about 2.5 million in spring 2019.
- It jumped to 3.721 million in 2020-21, then dropped to 3.135 million in 2021-22.
- Among states that published 2024-25 homeschool counts, average growth was 4.9%, more than double the old 2% pre-pandemic pace cited in that state series.
- 80% of those reporting states posted a year-over-year increase.
- 36% of reporting states set an all-time high, including Georgia, Minnesota, Nebraska, Ohio, Pennsylvania, and Wyoming.
- South Carolina rose 21.5%, Vermont 17%, Ohio 15%, and New Hampshire 14.5%. Louisiana rose only 1%.
- Federal charter membership rose 98,642 students, or 2.56%, from 2023-24 to 2024-25.
- From 2019-20 to 2024-25, one national charter compilation recorded a gain of 492,210 students, or 14.69%.
Why do homeschool totals differ by source?
No federal administrative file counts every homeschooler in the U.S. the way Common Core of Data counts public members. Treat every national homeschool total as a constructed estimate.
- Raw registers from 23 reporting states produced a population-weighted mean of only 4.18% in spring 2025.
- After a 20% undercount adjustment for non-registration and missing ages, that state mean became 5.016%.
- A 15% adjustment on the Pulse homeschool rate produced 7.509%.
- The published 6.262% national rate is the mean of those two adjusted cuts, not a student-level roster.
- About 30 states plus D.C. publish annual homeschool counts. The rest do not, so national tallies lean on survey weights.
- A federal household education survey put home instruction at 5.2% of children ages 5-17 in 2022-23, a different year and a different question than state affidavits.
- Pre-pandemic federal survey work had homeschooling near 2.8% in 2019, which is why “doubled” and “still about 6%” can both appear in the same paragraph without describing the same file.
- Counts that include virtual charters, district independent study, or hybrid academies will read high next to parent-led-only estimates.
What happened to Catholic enrollment after decades of decline?
Catholic schools are the only one of the three sectors with a clean annual census from the same association. The story is a long drop, a pandemic trough, a short rebound, then a small loss again.
- PK-12 Catholic enrollment was 1,693,327 in 2023-24, unchanged from 2022-23 (0.0%).
- The trough year was 2021, at 1,626,291 students, after which enrollment recovered into the 1.69 million range.
- In 2016 the same series counted 1,915,836 students.
- From 2016 to 2026 the loss was 240,929 students, or 12.6%.
- The 2025-26 one-year change was a decline of 8,599 students, or 0.5%.
- Mid-1960s enrollment peaked near 5,253,000 students in 12,893 schools.
- For 2025-26 the split was 1,155,344 elementary and middle school students and 519,563 secondary students.
- The 2024-25 split was 1,163,827 elementary and middle and 519,679 secondary, so the newest loss landed mostly in the lower grades.
How close are charter schools to four million students?
Charter growth is real and slower than the homeschool surge. It also sits inside public enrollment, so adding charter students to the public total double-counts them.
- Operating charter schools numbered 8,048 in 2024-25, up from 8,010 in 2023-24.
- A 2025 sector review put the campus count above 8,100 and enrollment near 4 million.
- Over six years that review recorded about 15% charter enrollment growth.
- In the most recent year of that compilation, charters added 111,349 students while district schools lost 221,729.
- 41 of 43 charter states gained students across those six years.
- Subtracting federal charter membership from 2024-25 public membership leaves about 45.3 million students in non-charter public schools.
- Rated charter operators still reported waitlists near 19% of enrollment in fiscal 2025, even as sector analysts flagged homeschooling and vouchers as competing demand.
Survey shares and state registers do not rank states the same way. Pulse asks households. Registers count families who filed paperwork. Use both, and do not treat a 16% survey share as a roster.
- Pulse data for 2023-24 put Alaska first at 16.15% of school-age children, then Tennessee at 10.75% and Montana at 9.03%.
- The same survey put Connecticut at 3.01%, D.C. at 3.04%, and Massachusetts at 3.39%.
- Alaska’s Pulse share rose 3.6 points from 2022-23, when it was already first at 12.56%.
- Tennessee rose 1.7 points from 9.02%. Rhode Island rose 2.5 points.
- D.C. fell 5.5 points in that Pulse year. Hawaii fell 1.7 points. Maryland fell 1.3 points.
- An earlier state-agency compilation for 2023-24 listed Alaska near 12.6%, Tennessee and West Virginia near 9%, and Montana and Missouri near 8%.
- Among 2024-25 state registers used in a 23-state file, North Carolina counted 165,243 homeschool students (9.47% of that state’s school-age group).
- South Dakota’s register share was 7.02% (11,489 students). Arkansas was 6.79% (35,419). Massachusetts was 1.21% (12,203).
- Those register shares run lower than Pulse shares in the same states because registers miss families who never file.
Which states give charters a large slice of public enrollment?
Charter “market share” is a share of public enrollment, not of all children. A state can lead in charter share and still trail in homeschool share.
- D.C. charters held 45.3% of public enrollment in 2022-23 federal tables and 47.1% in a 2025 sector model.
- Arizona charters held 20.5% of public enrollment in 2022-23.
- Colorado charters served 15.5% of public-school students in 2024-25 (136,218 students in 262 schools), up from 15.3% the year before.
- Nevada’s state charter authority enrolled 70,534 students on October 2025 validation day, 14.8% of statewide public membership.
- A 2025 charter brief counted 11 states plus D.C. at 10% or more of public enrollment, with D.C. listed at 47.79%.
- California, Texas, Florida, Arizona, and New York together held about half of a 3.87 million national charter count used in a January 2026 credit review.
- Rated charter operators in Nevada reported waitlists equal to 82.0% of enrollment in fiscal 2025. Pennsylvania’s rated median was 65.8%. Florida’s was 41.0%. Arizona’s was 4.4%.
- Colorado charters dipped to 135,233 students in 2023-24, then recovered. First-time annual declines happen even in high-share states.
How many Catholic schools have waitlists, and how many closed?
Catholic supply is tight in some zip codes and gone in others. National enrollment can look flat while the school list shrinks.
- 2,189 Catholic schools reported admission waitlists for 2025-26.
- In 2024-25, 39.3% of Catholic schools had a waiting list.
- That year 63 Catholic schools closed and 24 opened.
- Closures in the early 2000s ran near 130 a year, so the current close-open gap is smaller than the old pattern and still net negative.
- 31% of Catholic schools used a parental choice program in 2024-25.
- 18% of Catholic students used those programs, up almost 5 points from the prior year.
- Professional staff numbered 154,258, with a student-teacher ratio of 10.9 to 1.
- 10% of 2025-26 Catholic enrollment, 167,002 students, had a diagnosed disability, most often ADHD or a specific learning disability.
How do race and religion differ across the three sectors?
White families are still overrepresented in homeschool samples. The gap is narrower than the old stereotype, and Catholic schools now enroll a large non-Catholic minority.
- In a 2024 national parent survey, 69% of homeschool parents identified as White, versus 56% of all parents in the sample.
- That survey put Hispanic homeschool households at 15%, Black households at 10%, and Asian households at 5%.
- Pulse household data for homeschoolers in 2023-24 read 63% White non-Hispanic, 18% Hispanic, 10% Black, 2% Asian, and 7% two or more or other races.
- A 2022-23 federal education survey implied about 29% of homeschool students were students of color. Pulse implied about 40%. Those are different instruments, not a blended average.
- In that 2022-23 survey, 5.1% of White students were homeschooled, compared with 1.7% of Black students and 1.8% of Hispanic students.
- Catholic schools in 2025-26 reported 35.1% racial-minority enrollment, including 17.1% Hispanic or Latino students.
- Non-Catholic students numbered 372,244, or 22.2% of Catholic enrollment that year.
- 44% of homeschool parents in the 2024 parent survey identified as Republican, versus 36% of parents overall, so a majority still sat outside that party label.
How do hybrid, co-op, and virtual programs blur sector lines?
A child can be a homeschooler on Monday, a co-op student on Tuesday, and a charter independent-study enrollee on the ledger. Sector totals double-count if you ignore that.
- In a 2024 parent survey of homeschool households, 71% of homeschool students were full-time at home.
- The other 29% mixed modes: 18% in a co-op, 8% in a hybrid school, and 3% in some other arrangement.
- 88% of homeschooling parents used some supplemental support, versus about 44% of parents overall.
- Among homeschool parents, 44% used other online resources, 29% joined a co-op, 27% took an online class, and 24% enrolled in an online school or virtual program.
- 22% of those homeschool parents said they had access to public funding. Another 25% did not know. More than half said they had none.
- California independent-study charters and Alaska correspondence programs pay families through public enrollment, often about $2,000 to $4,500 in instructional funds, which moves the child out of a pure homeschool count.
- Virtual homeschool-style charters can enroll students across county lines, so a district’s charter gain may be another county’s homeschool-looking family.
How is school choice money moving between sectors?
Vouchers and ESAs do not automatically grow Catholic schools. Some dollars land in parish tuition. Some land in parent-directed accounts that look like homeschooling with a debit card.
- Private-choice programs (ESAs, vouchers, tax-credit scholarships, refundable credits) enrolled about 1.5 million students in 2025-26 across 34 states plus D.C. and Puerto Rico.
- A 2026 sector model assigned 2.8% of students to those private-choice programs, a slice that overlaps private schools and some home-based instruction.
- Arizona’s universal ESA pays about $7,000 to $8,000 per student for approved uses that include curriculum and tutoring.
- In Florida Catholic schools, more than 90% of students used a state scholarship in the latest state brief, versus 19.4% of Catholic students nationwide in that same brief.
- As of mid-September 2026, 31 states had said they would join the federal Education Freedom Tax Credit, which is slated to start January 1, 2027.
- Taking an ESA in Arizona or Florida usually changes the child’s legal label from statutory homeschooler to program participant, even if the parent still teaches at the kitchen table.
- Charter seats do not require an ESA. They are already public, so choice-program growth can compete with charters instead of feeding them.
How do public enrollment losses compare with alternative gains?
Birth rates explain part of the public-school drop. Family exits explain the rest, and the residual is still large.
- Public enrollment fell from 50.8 million in fall 2019 to 49.4 million in fall 2024, a loss of more than 1.4 million students, or 2.8%.
- The federal public file dropped 134,504 students, or 0.27%, from 2023-24 to 2024-25.
- The share of children outside public schools averaged 9.7% before COVID, peaked at 13.1% in 2021-22, and was still 12.6% in 2023-24.
- From 2019-20 to 2021-22, about 2.05 million additional students were missing from matched public and private rolls, a 450% jump in that residual.
- Private-school point estimates rose 365,062, or 7.7%, from 2021-22 to 2023-24.
- In states tracked for 2017-18 through 2022-23, homeschool registrations were 51% higher at the end of that span, private enrollment was up 7%, and public enrollment was down 4%.
- One long-run scenario keeps traditional public enrollment near 43.06 million in 2023-24 and drops it as low as 34.57 million by 2050 if post-2020 exit rates hold. Population decline alone accounts for about 2.2 million of that projected loss.
- Massachusetts, used as a five-year case, had local public enrollment 1.9% below its pre-pandemic trend in fall 2024, private enrollment about 14% above trend, and homeschool enrollment about 45% above trend.
What do per-pupil costs, tuition, and taxpayer savings look like?
The three sectors do not price the same hour of instruction. Public and charter costs show up in tax bills. Catholic costs show up as tuition plus parish subsidy. Homeschool costs show up on a family card, unless an ESA is in the mix.
- Public current spending averaged $17,873 per pupil in 2024-25, up 3.6% from $17,250 the year before.
- The same series projects $18,898 per pupil for 2025-26, a 5.7% jump.
- New York spent $32,370 per pupil in 2024-25. Idaho spent $11,578. Arizona spent $11,987.
- Census current spending for FY2024 sat at $17,619 per pupil, a different accounting cut from the association estimate above.
- One 2025 synthesis put homeschool family outlays near $600 per student per year for materials. That figure excludes a parent’s lost wages.
- Practical 2026 family budgets cluster between $700 and $1,800 per child. Enrichment-heavy years run $2,500 to $4,000.
- A Utah cost study priced a “full” homeschool year, including extras meant to match a public-school experience, at about $10,600 per student.
- Catholic elementary tuition for parish families averaged about $5,330 a year in the 2024 compilation still cited in 2026 guides. High school averaged about $11,200.
- In the Archdiocese of Baltimore, Catholic high-school tuition that still used a sticker price averaged $20,161 for 2025-26, up 5.6%. Nearby non-Catholic private highs averaged $35,414.
- National private tuition, all types, sits near $14,000 to $15,000 in 2026 estimates. Religious schools run closer to $8,000 to $9,350.
- Homeschool students in 2024-25 were credited with more than $64 billion in taxpayer spending avoided, using public per-pupil outlays and excluding capital costs. That is an accounting claim, not cash returned to districts.
Why do parents leave traditional public schools?
When examining why parents homeschool, religion did not disappear. It lost first place. Safety and academics now dominate the checkboxes, and parents usually tick more than one.
- In the 2023 federal household education survey, 83% of homeschool parents named concern about other schools’ environments, including safety, drugs, or peer pressure, as a reason.
- 28% called that environment concern their single most important reason.
- 72% cited dissatisfaction with academic instruction. 75% cited a desire to provide moral instruction.
- About 53% still listed religious instruction as a factor in later summaries of that survey wave. Only a small share called religion the top reason.
- Wanting more family time appeared as a reason for 72% of those homeschool parents.
- An older 2019 wave had already shown environment at 80% important and 25% most important, so the ranking shift predated the latest file.
- In the 2025 Schooling in America parent survey, 56% said they would pick a charter, private school, or homeschool if the choice were unconstrained. 44% would stay with a residential district school.
- Actual enrollment that year still sat near 80% in district schools, 7% in charters, 9% in private schools, and 5% in homeschools.
- Private-school parents reported the highest satisfaction, then homeschool parents, then charter parents. District-school parents sat last.
- Location remained the top reason district parents gave for staying. Academic quality led for private and charter choosers. A safe environment led for homeschool parents.
How do test scores, college going, and parent satisfaction compare?
Homeschool test studies are not random-assignment trials. Families that sit for a standardized test are a selected group. Report the scores, then report the limits.
- A 2026 review of peer-reviewed achievement studies found that 62% showed homeschool students statistically ahead of institutionally schooled peers.
- Homeschool samples typically land 15 to 25 percentile points above the public-school mean on standardized batteries, where the public mean is about the 50th percentile.
- A 2015 subsample of Black homeschool students scored 23 to 42 percentile points above Black public-school students on those same kinds of tests.
- A newer nationwide file of homeschool statistics put mean percentiles in the 75 to 79 range across reading, language, math, social studies, and science.
- After two controls, that file’s weighted means sat in the 74 to 82 percentile band versus the conventional-school norm group.
- Homeschool SAT totals last published as a separate cohort averaged 1092 in 2014, versus 1010 nationally. ACT composites were 22.8 versus 21.0. Those agencies later stopped publishing a homeschool breakout.
- The ACT-tested class of 2025 posted a national composite of 19.4. About 30% met at least three college-readiness benchmarks.
- A 2023 adult survey found bachelor’s attainment at 45% for short-term homeschoolers and 46% for non-homeschoolers. Medium-term homeschoolers were at 29%. Long-term homeschoolers were at 27%.
- 47% of medium-term and 41% of long-term homeschoolers stopped at a high-school diploma or equivalent, versus 27% of non-homeschoolers.
- Homeschool freshmen in an older four-year-college study posted a first-year GPA of 3.37 versus 3.08 for the incoming class. That is one campus, not a national census.
- Selective colleges that dropped testing in 2020 have been putting the SAT or ACT back. Harvard, Yale, Stanford, MIT, and the University System of Georgia require scores again for recent cycles, which raises the cost of a parent-built transcript with no outside exam.
What are the recent developments?
Policy, not pedagogy, moved fastest in 2025 and 2026. The new dollars mostly follow students who already left district schools.
- Texas opened Education Freedom Accounts for 2026-27 with $1 billion in first-year funding.
- Families filed more than 274,000 applications. The first lottery issued 95,934 awards and parked 152,702 eligible students on a waitlist.
- Private-school awards are $10,474. Homeschool awards are $2,000. Students with disabilities can receive up to $30,000, though few have drawn the full amount.
- By mid-August 2026, funded students numbered about 101,600, with more than 100,000 still waitlisted. About 70% of joiners were already in private school or homeschool.
- The Texas comptroller asked lawmakers to double the program to $2 billion for the next biennium.
- Eighteen states ran universal private-choice programs as of August 2026, including new 2025 laws in Idaho, Indiana, New Hampshire, Tennessee, Texas, and Wyoming.
- The federal Education Freedom Tax Credit, created July 4, 2025, allows up to $1,700 per donor for gifts to scholarship organizations. It is scheduled to start January 1, 2027.
- Federal Charter Schools Program funding was held at $440 million in the FY2026 tables used in early-2026 budget notes.
- Rated charter operators saw fall 2024 median enrollment rise only to about 1,262 students from 1,251. Preliminary fall 2025 medians pointed down.
- On June 26, 2026, Texas approved mandatory literature and social-studies standards that embed biblical texts for all public schools, charters included. Private and homeschool programs sit outside that mandate.
Three-Way Comparative Sector Analysis (2024-2025)
Tri-Sector Audit| Comparative Metric | Public Charters | Homeschooling | Catholic Parochial |
|---|---|---|---|
| Student Enrollment | 3,784,000 | 3,408,000 | 1,684,000 |
| K-12 Student Share | 6.95% | 6.26% | 3.10% |
| Household Outlay | bash (Tuition-free) | ,295 – ,636 / yr | ,840 avg tuition |
| Funding Mechanism | State & local tax per pupil | Self-funded / ESA grants | Family tuition & parish subsidy |
| Testing Requirements | Mandatory state exams | Per state statute option | Standardized private norming |
Editor’s Choice
These are the figures that change a budget, a seat count, or a legal label. They are restated for planning, not copied from a body bullet.
- Homeschooling is now the larger religious-adjacent alternative to Catholic schools and the nearest peer to charters, at 3.4 million home students versus 1.67 million Catholic students and 3.95 million federal charter students.
- Pulse still finds most children in public schools (83%), but the homeschool slice (6.5% in that cut) is no longer a niche next to private schools (10.5%).
- Alaska’s Pulse homeschool share (16.15%) is five times Massachusetts’ register share (1.21%). State policy and measurement method both move the rank.
- D.C. is a charter city (47% of public enrollment in recent models). Alaska is a homeschool state. Florida is a scholarship state. Do not copy one state’s mix onto another.
- Catholic schools can post 2,189 waitlists and still close 63 campuses in a year. Demand is local. Supply is not.
- Only 22% of surveyed homeschool parents said they already have public funds. Choice statutes are expanding faster than household take-up.
- Texas’s first ESA year drew 274,000 applications against $1 billion. Most funded seats went to families already outside district schools.
- A homeschool materials budget of about $600 to $1,800 is not comparable to $17,873 in public current spending unless you also price a parent’s time.
- 83% of homeschool parents name school environment. 56% of all parents say they would leave the assigned district school if they could. Preference and enrollment still do not match.
- Test-score studies that put homeschool samples in the 75th percentile sit beside adult surveys that put long-term homeschoolers’ bachelor’s rates at 27%. Those findings can both be true if the testers and the adults are different groups.
- Federal charter aid stayed at $440 million while a federal scholarship tax credit is queued for 2027. The next enrollment fight is fiscal, not rhetorical.
Frequently Asked Questions
About 3.408 million K-12 students were homeschooled in 2024-25 (range 3.067 million to 3.749 million). Catholic schools enrolled 1,683,506 that year and 1,674,907 in 2025-26. Federal charter membership was 3,949,735 in 2024-25.
Homeschooling rose from about 2.5 million students in spring 2019 to 3.408 million in 2024-25. Reporting states grew 4.9% on average in 2024-25, and 80% of those states posted an increase. Federal charter membership rose only 2.56% that same year, or 98,642 students.
Public current spending averaged $17,873 per pupil in 2024-25 and is projected at $18,898 for 2025-26. Homeschool families often spend about $600 to $1,800 per child on materials. Parish Catholic elementary tuition has averaged about $5,330, with high school near $11,200.
Texas opened education savings accounts for 2026-27 with $1 billion, more than 274,000 applications, $10,474 for private-school awards, and $2,000 for homeschool awards. Private-choice programs already enrolled about 1.5 million students in 2025-26. A federal scholarship tax credit of up to $1,700 per donor is slated to start January 1, 2027.
The 2024-25 blended homeschool estimate is 6.262% of the school-age population. A late-summer 2024 household survey put the split at 83.016% public, 10.453% private, and 6.530% homeschooled. Charters, already inside the public total, were 8.02% of public membership.
Homeschooling, Catholic schools, and charters now compete for the same unsettled fifth of U.S. childhood. A district that budgets as if the 2019 mix will return will miss both the students and the dollars. A Catholic school that treats scholarships as a waiting-list cure still has to staff buildings that close when the parish cannot fill kindergarten. A charter that ignores ESA homeschool awards will count “demand” that never walks through the lottery. Use the headcount that matches the legal status of the child, label the year on every percentage, and plan for a sector split that has already stopped looking like 2019.
Sources and editing
This article cites state departments of education, the National Center for Education Statistics (NCES), U.S. Census Bureau Household Pulse surveys, and peer-reviewed research.
We may use AI tools to sort tables or improve wording. A human reviewer checks the numbers, citations, and claims before publication.
