
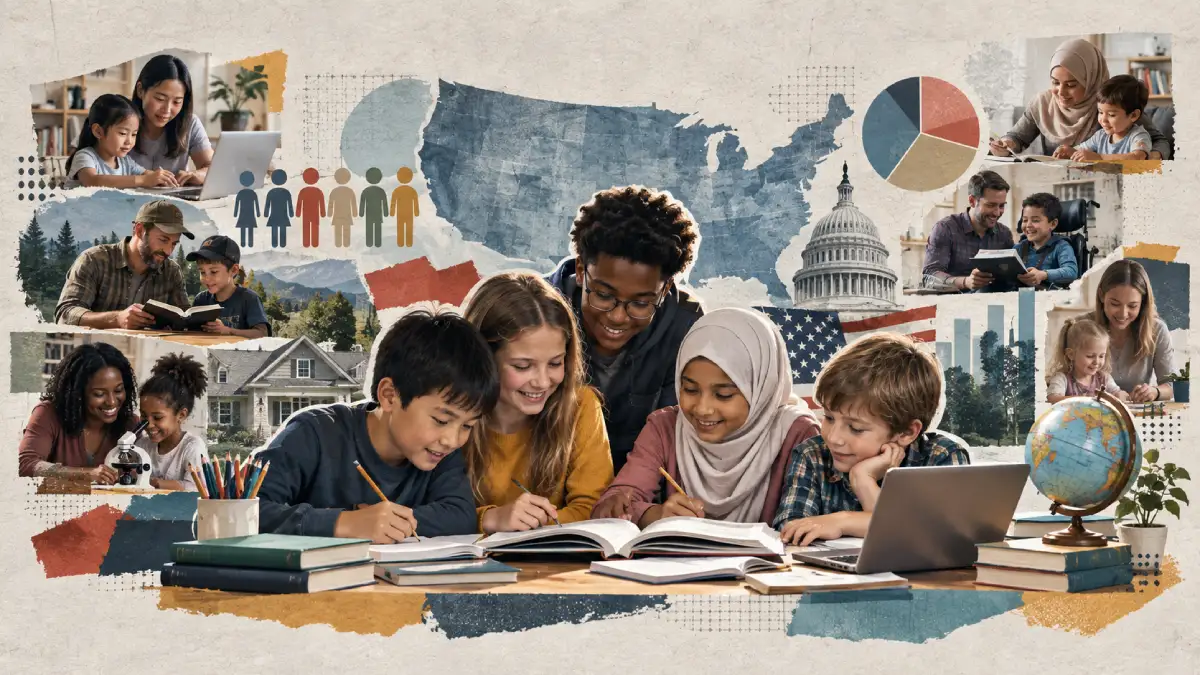
Homeschooling demographics in the US no longer match a small religious niche. In 2024-25, one national synthesis put K-12 homeschool enrollment at 3.408 million students. That is 6.262% of school-age children. A tighter 2022-23 federal household survey put the share at 3.4%, or about 1.76 million. Those are different cuts. Both sit well above the pre-pandemic rate near 3%.
County budget staff who still size next year’s classrooms from 2018 public rolls will overbuild seats. A co-op organizer pricing a shared lab has the same problem if she treats home education as a rural church pocket.
Who homeschools now is wider than that stereotype. A 2024 parent survey found Republicans at 44% of homeschool parents. Democrats plus independents still make a majority when you add them. Weekly churchgoers are 44% of homeschool parents. Another 31% never attend. Household income runs under $50,000 and over $100,000. Race shares move with the survey you pick. Students of color are 29% on the federal definition and about 40% on Pulse responses.
If you are searching how many US students are homeschooled, who homeschool families are, or how 2024-25 and 2025-26 counts compare, start with that range, synthesized in our foundational reference on homeschooling statistics. Then read the splits. This piece covers headcount, growth, race, income, parent education, party, religion, reasons, state rates, urban and rural mix, family size, hybrid and co-op use, special needs, time spent in homeschool, and public funding. Recent developments sit near the end. Do not average the two national totals into one fake number.
95% CI [3.07M – 3.75M] across 23 reporting states
Census Pulse benchmark (vs 3.4% tight federal count)
19% Hispanic, 12% Black, 2% Asian, 7% multiracial
29% use co-ops, hybrids, or multi-sector classes
How Many US Students Are Homeschooled?
- A February 2026 synthesis of 23-state registration files and Census Pulse responses puts 3.408 million K-12 homeschool students in the United States during the 2024-25 school year, with a published range of 3.067 million to 3.749 million.
- That count represents 6.262% of the school-age population.
- Census Pulse data released Oct. 3, 2024, put the homeschool share at 6.530%, with 83.016% of school-age children in public school and 10.453% in private school.
- The same synthesis starts from 54,417,758 U.S. residents ages 5 through 17 as of July 1, 2024.
- Raw registration in those 23 states, before an undercount adjustment, averages 4.18% of school-age children; a 20% undercount adjustment lifts that mean to 5.016%, reconciled through our statistical methodology.
- The 2022-23 federal household survey (NCES NHES) uses a tighter definition and reports 3.4% of K-12 students as homeschooled, or about 1.76 million children.
- That same federal survey finds 5.2% of students received instruction at home in 2022-23 once full-time virtual enrollment is added, up from 3.7% in 2018-19.
- Inside that 5.2% home-instruction total, 2.5% of students were in full-time virtual programs and 0.7% were virtual homeschoolers.
- The 3.408 million 2024-25 estimate is about double 2025 Catholic school enrollment of 1.684 million and sits just under public charter enrollment of 3.784 million in 2023-24.
- The two national series are different cuts, not a blended average: the federal household survey counts fewer students because it excludes many virtual and mixed arrangements that state files and Pulse responses still tag as homeschool.
Growth Since 2019 and the 2024-25 School Year
- Pre-pandemic homeschool participation sat near 3% of K-12 students, and the 2018-19 federal rate was 2.8%.
- Federal household counts moved from 1.45 million homeschool students in 2018-19 to 1.76 million in 2022-23 (virtually matching 2012 levels), tracked across our longitudinal homeschool enrollment by year series.
- A separate 2024-25 estimate of 3.408 million is up from 2.5 million in spring 2019 on that series, which includes more state-reported students than the federal survey.
- Homeschool enrollment in reporting states grew at an average 4.9% in 2024-25, more than double the pre-pandemic pace of about 2% a year.
- 80% of states that had posted 2024-25 figures showed a year-over-year increase.
- South Carolina led that round at +21.5%, followed by Vermont (+17%), Ohio (+15%), and New Hampshire (+14.5%); Louisiana grew only 1%.
- 36% of reporting states posted their highest homeschool counts on record in 2024-25, above their pandemic peaks.
- Pulse responses for 2023-24 put the national homeschool share at 5.92%, after a brief post-reopening dip and before the 2024-25 rebound in state files.
- Among Black households, the Pulse homeschool rate jumped from 3.3% in spring 2020 to 16.1% in fall 2020 (documented in our dedicated report on Black homeschooling statistics), the sharpest short-run demographic spike on record.
- After a 39% jump in 2020-21, state-reported totals fell about 3% in 2021-22 and 7% in 2022-23, then turned up again in 2023-24 and 2024-25.
Race and Ethnicity of Homeschool Students
- The 2022-23 federal household survey finds 29% of homeschool students are students of color, up from 25% in 1998-99.
- On that federal cut, homeschool students in 2022-23 were about 6% Black, 14% Hispanic, 7% two or more races, and under 2% Asian.
- White students were homeschooled at 5.1% in 2022-23, compared with 1.7% of Black students and 1.8% of Hispanic students.
- Students of color are about 51% of all school-age children, so they remain underrepresented on the federal homeschool definition.
- Census Pulse responses for 2022-23 look different: 60% of homeschool-household respondents were white, 19% Hispanic, 12% Black, 2% Asian, and 7% two or more or other races, or about 40% students of color.
- A spring 2024 national parent survey found homeschool parents were 69% white, 15% Hispanic, 10% Black, and 5% Asian, against U.S. population shares of 57%, 20%, 14%, and 7%.
- A 2026 research brief on homeschool families puts 41% of U.S. homeschool families as non-white/non-Hispanic.
- Delaware, one of the few states that publishes race on homeschool rolls, went from 68% white in 2022-23 to 66% white in 2023-24 as Black and Hispanic shares each rose 1 to 2 points.
- White families still supply the largest single group in every national series; the argument is about how wide the gap is, not whether the old all-white stereotype still holds.
Household Income of Homeschool Families
- The 2019 federal household survey found nearly half of homeschool students, about 49%, lived in households earning more than $75,000.
- Lower-income households homeschool at lower rates than higher-income households on that federal series.
- Among Pulse respondents with a homeschooled child who reported 2023 income, 10% earned under $25,000, 8% earned $25,000-$34,999, and 10% earned $35,000-$49,999, or 28% under $50,000.
- The same 2023 Pulse slice shows 13% at $50,000-$74,999, 12% at $75,000-$99,999, and 13% at $100,000-$149,999.
- Only 5% of those homeschool households reported $150,000-$199,999 and another 5% reported $200,000 or more; 24% skipped the income item.
- In an earlier Pulse window covering 2022-23, 49% of homeschool families who stated income earned under $100,000 and 23% earned above $100,000.
- A spring 2024 national parent survey found 46% of homeschool parents in households under $50,000, versus 36% of all K-12 parents in the same sample.
- Median U.S. household income was $77,540 in 2022, so the Pulse reporters who answered sit across that line rather than stacked above it.
- Income nonresponse is high in Pulse homeschool samples (24% in the 2023 item, 28% in the 2022-23 window), so dollar-share figures from those surveys should be read as incomplete, not as a full ledger.
Parent Education Levels
- Pulse data for 2023-24 homeschool households show 9% of responding parents with less than a high school diploma, 29% with a high school diploma or GED, 33% with some college or an associate degree, and 29% with a bachelor’s degree or higher.
- The 2019 federal household survey told a different story: 52% of homeschool parents held a bachelor’s, graduate, or professional degree, and fewer than 25% had only a high school diploma or less.
- A spring 2024 parent survey found 67% of homeschool parents had less than a bachelor’s degree, compared with 60% of all parents in that sample.
- Parents who have attended at least some college still homeschool at higher rates than parents with only a high school education, per the 2019 federal survey.
- The Pulse 2023-24 mix puts 62% of homeschool caregivers at high school plus some college or an associate degree, which is the middle of the credential range, not the top.
- Those three sources do not measure the same year or the same parent, so the bachelor’s-or-higher share should be treated as a band from about 29% to 52%, not as one settled percentage.
- Homeschool achievement studies continue to find test scores above public-school averages across parent education levels; that outcome claim is separate from the credential mix of the adults doing the teaching.
Political Party and Ideology
- In a spring 2024 national survey of 3,191 parents, 44% of homeschool parents identified as Republican, against 36% of all parents in the same sample.
- Democratic identification ran the other way: 29% of homeschool parents versus 37% of parents overall.
- Independent identification matched the full parent sample at 27% on both sides.
- On ideology, 43% of homeschool parents called themselves conservative, versus 32% of all parents.
- Liberals were 25% of homeschool parents and 29% of all parents; moderates were 32% versus 39%.
- One in four homeschool parents in that survey identified as liberal, and nearly three in ten identified as Democrats, so the rightward tilt is real and still short of a one-party bloc.
- Republicans are overrepresented, yet the majority of homeschool parents in the survey were Democrats or independents when those two groups are added (56%).
- Older portraits of the sector as almost entirely conservative Evangelical households do not match this 2024 parent cut.
Religion and Church Attendance
- 44% of homeschool parents in the spring 2024 survey said they attend religious services weekly or more, compared with 33% of all parents.
- 31% of homeschool parents said they never attend, almost the same as the 30% never-attend share among all parents.
- Another 25% of homeschool parents attend, but less than weekly.
- Weekly attendance is the clear gap; non-attendance is not.
- On the 2022-23 federal household survey, 53% of homeschool parents listed a desire to provide religious instruction as an important reason, which is well below the shares who named school environment or academics.
- Religious instruction as the single most important reason sat near 16% in the mid-2010s federal surveys and was not the top 2022-23 pick.
- A 2024 research brief notes that more than 30% of homeschool families never attend services, and treats that as evidence that newer, more secular households have entered the sector rather than that religious families left it.
- Among adults who were themselves homeschooled, one later survey found 48% attend church at least weekly and 51% read the Bible or another sacred text weekly, which describes graduates, not the current parent pool.
Why Do Families Homeschool?
Understanding shifting family motives illuminates modern demographic patterns. See our companion study on why parents choose homeschooling for detailed longitudinal motivation data.
- Parents of homeschooled children in the 2022-23 federal household survey most often marked concern about the school environment, including safety, drugs, or peer pressure: 83% called it important and 28% called it the single most important reason.
- Dissatisfaction with academic instruction at other schools was important for 72% and the most important reason for 17%.
- A desire to provide moral instruction was important for 75%.
- A desire to emphasize family life together was important for 72%.
- Religious instruction was important for 53%, and a nontraditional approach was important for 50%.
- Environment plus academics together accounted for nearly half of “most important” answers.
- 21% of homeschool parents said another special need that they felt a school could not or would not meet was a reason.
- 15% cited a physical or mental health problem lasting six months or more; 2% cited a temporary illness that kept the child out of school.
- These items stack; most parents marked more than one reason, so the percentages are not a forced single-choice pie.
Homeschool Rates by State and Region
- Among 23 states with usable 2024-25 registration files, North Carolina had the highest homeschool share at 9.47%, or 165,243 students, up from 157,642 in 2023-24.
- South Dakota followed at 7.02% (11,489 students) and Arkansas at 6.79% (35,419).
- Maine stood at 6.31% (11,785), Georgia at 4.71% (89,510), and Florida at 4.54% (152,871 students in 114,370 families).
- At the low end of that registration table, Massachusetts was 1.21% (12,203 students), Rhode Island 2.03%, and Pennsylvania 2.28%.
- Census Pulse rates for 2023-24, a different instrument, put Alaska at 16.15%, Tennessee at 10.75%, and Montana at 9.03%.
- The same Pulse year put Connecticut at 3.01%, Washington, D.C., at 3.04%, and Massachusetts at 3.39%.
- Alaska’s Pulse share had already been 12.56% in 2022-23, then rose 3.6 points; D.C. dropped 5.5 points in 2023-24.
- Homeschool shares in the Midwest, South, and West track other sectors more closely than the Northeast, which posts lower rates on parent surveys.
- State files and Pulse ranks do not match state for state because only some states require registration and Pulse is a household survey, not an enrollment census.
Urban, Suburban, and Rural Split
- The 2019 federal household survey found 41% of homeschool students in suburbs, 27% in cities, 26% in rural areas, and 6% in towns.
- City plus suburban students were about 64% of homeschoolers on that survey, so the sector was not a rural-only count even before the pandemic.
- In the spring 2024 parent survey, 24% of homeschool parents lived in urban areas versus 33% of all parents.
- Rural homeschool parents were 25%, versus 15% of all parents.
- Suburban shares were close: 41% of homeschool parents and 43% of all parents.
- Small-town shares were also close: 11% of homeschool parents and 9% of all parents.
- Homeschooling is more common as a rate in rural counties and less common in big cities; the largest raw group is still suburban.
- Inside growth states the pattern splits further: some urban districts rose while others fell, and some rural districts carried most of a state’s 2024-25 gain.
Family Structure and Number of Children
- Homeschool parents in the spring 2024 survey were married at 60%, against 59% of all parents, so marital status barely moves.
- Those homeschool households had 1.7 K-12 children living at home, against 1.6 in non-homeschooling families in the same survey.
- Millennials were the largest adult group on both sides: 52% of homeschool parents and 55% of all parents.
- The 2019 federal household survey found 62% of homeschool households had three or more children, against about 28% of U.S. households with children.
- That 2019 family-size gap is older than the 2024 parent survey and should not be blended into one number.
- Secondary compilations often split homeschool households as about 83% two-parent, 14% single-parent, and 3% non-parental; treat those shares as compiled estimates, not a fresh federal table.
- Larger sibling groups show up more often in homeschool samples than in the average household with children, which affects co-op staffing and curriculum seating more than party ID does.
Full-Time Homeschool vs Hybrid, Co-op, and Sector Mixing
- In a spring 2024 national parent survey, 71% of homeschool students were homeschooled full-time.
- The other 29% used another arrangement: co-op 18%, hybrid school 8%, or something else 3%.
- Among households with at least one homeschooled child, 44% also used another sector for a child in the home.
- Those mixed households included traditional public school at 35%, public charter at 9%, and private school at 13%; a household can land in more than one of those buckets.
- An analysis of federal household surveys from 2012, 2016, and 2019 found about half of homeschooling households practiced sector mixing, and 53% of multi-child homeschool households mixed sectors.
- Mixing among all U.S. households with children was much smaller, about 2.5% to 3.5% depending on the survey wave.
- The 2025 hybrid-school survey put average enrollment at 197 students per site, with mean tuition $5,743 and median $4,928.
- 61% of students in those hybrid programs were classified as homeschoolers, 10% as enrolled in a school, and 29% as mixed or other.
- Typical on-site time ran about 2.9 days a week in K-5, 2.7 days in grades 6-8, and 3.2 days in grades 9-12.
Instructional Model & Co-op Distribution (2025-2026)
Proportional breakdown of primary home education delivery formats across surveyed cohorts.
| Instructional Delivery Format | Estimated Count | Share | 95% CI |
|---|---|---|---|
Full-Time Independent at Home | 2,420,000 | 71.0% | ± 1.2% |
Homeschool Co-op Collaborative | 613,000 | 18.0% | ± 0.9% |
Hybrid Model (2-3 Days On-Site) | 273,000 | 8.0% | ± 0.6% |
Other Multi-Sector Combinations | 102,000 | 3.0% | ± 0.3% |
Special Needs and Disability Rates
- The 2019 federal household survey put diagnosed disability among homeschool students at about 15%, close to the public-school special-education share of about 14%.
- A later analysis of a large education dataset found 25% of homeschooled students reported a disability, versus 23% of students who were not homeschooled.
- Disability was 16% among first-choice homeschoolers and 36% among second-choice homeschoolers, meaning families who left a school after a problem.
- In the 2022-23 federal survey, 21% of homeschool parents said another special need that a school could not or would not meet was a reason they taught at home.
- 15% cited a physical or mental health problem lasting six months or more.
- A 2022 military-family survey found nearly 10% of military-connected families with a child with a disability had chosen homeschooling.
- Access to district evaluations and services still depends on state law: some states extend Child Find and limited services to homeschoolers, and some do not.
- Families using an education savings account in several ESA states give up district-delivered special education in exchange for account funds they can spend on therapy, tutors, or materials.
How Long Do Students Stay Homeschooled?
- Among U.S. adults who were ever homeschooled, 20% were homeschooled for only one year of K-12.
- 17% were homeschooled for all K-12 years.
- About 36% of ever-homeschooled adults were in the sector for only one or two years.
- Short-term homeschoolers (one to two years) spent, on average, more than 8 years in traditional public school and about 3 years in charter or private school.
- Adults homeschooled for only one year spent about 10 years in traditional public schools.
- A separate adult panel found 43% of ever-homeschooled adults were in homeschool for one to two years total and 11% for their entire K-12 career.
- Researchers tracking those adult samples put the all-years share under 20%, which undercuts the idea that a homeschool student stays home from kindergarten through graduation.
- Grade of entry and exit is scattered; students move in after kindergarten as often as they leave after a single middle-school year.
Public Funding, ESAs, and Supplemental Supports
- An April 2026 national parent survey by EdChoice found 88% of homeschooling parents used some supplemental resource or support, versus about 44% of parents overall.
- Among homeschooling parents in that survey, 44% used online resources, 29% joined a co-op, 27% took an online class, and 24% enrolled in an online school.
- Just over 22% of parents who homeschool at least one child said they have access to public funding; 25% did not know, and more than half said they do not.
- Public schools spent an average $18,853 per pupil in 2025, not counting capital outlays; one 2026 brief put taxpayer savings from 3.408 million homeschool students at more than $64 billion.
- Homeschool families in that same brief spent about $600 per student per year out of pocket.
- As of 2025, 13 states plus D.C. offered universal or near-universal private-choice programs, up from Arizona alone in 2022.
- Arizona’s ESA roll stood above 100,000 students at the end of 2025-26.
- Wyoming approved or found eligible 4,461 of 4,915 ESA applications for 2026-27 against 4,200 funded seats after a court fight froze 2025-26 payouts.
- In South Carolina’s 2026-27 scholarship round, 2,524 of 15,000 accepted students planned to “unbundle” at-home services, up from about 1,180 the year before.
Recent Developments
- A February 2026 national estimate put 2024-25 homeschool enrollment at 3.408 million students, or 6.262% of school-age children, and treated that level as holding after the post-closure dip.
- State registration files for 2024-25 showed growth in 80% of reporting states and record counts in 36% of them, including Georgia, Minnesota, Nebraska, Ohio, Pennsylvania, and Wyoming.
- Minnesota’s 2025-26 home-education count reached 32,024, a new high and about 55% above its pre-COVID level.
- North Carolina Division of Non-Public Education records showed its 2025-26 homeschool count fell 7.5% to 152,897 while private-school enrollment rose 6.1% to 143,998, a split that landed in the same year as continued voucher growth.
- Florida Department of Education reported home-education students numbered 152,871 in 2024-25 across 114,370 families; ESA participation in that state can pull students off the homeschool ledger when they take account funds.
- Texas enacted a statewide ESA in 2025 that can pay for private or home-based education; Idaho that year created a universal refundable tax credit of $5,000, or up to $7,500 for special-needs students.
- The Wyoming Supreme Court in May 2026 lifted an injunction on the state’s ESA, then the 2026-27 application pool exceeded funded seats.
- Hybrid programs drew a new legal fight in Pennsylvania in September 2026, where a three-day homeschool hybrid was treated by the state as uncertified childcare.
- An April 2026 parent survey also flagged a knowledge gap on money: a quarter of homeschool parents did not know whether their state offered them public funds.
Editor’s Choice
- Plan with a range, not a single headcount: about 1.76 million on the tight 2022-23 federal definition, versus 3.408 million (range 3.067 million to 3.749 million) on the 2024-25 state-plus-Pulse synthesis.
- Homeschool is no longer a rounding error next to other sectors. The larger 2024-25 estimate sits near public charter enrollment (3.784 million) and about double Catholic enrollment (1.684 million), detailed in our comparative analysis of homeschool vs Catholic vs charter school enrollment.
- Growth did not stop when buildings reopened. Reporting states averaged 4.9% growth in 2024-25, and 36% of them posted record highs.
- Race shares depend on the instrument. Students of color are 29% on the federal household survey and about 40% on Pulse; both still sit below the 51% share of all school-age children.
- Income is mixed, not elite-only. 46% of homeschool parents in a 2024 survey lived under $50,000, a higher poor-household share than among parents overall (36%).
- Parent credentials disagree by source. Treat bachelor’s-or-higher as a band from 29% (Pulse 2023-24) to 52% (federal survey 2019).
- Party ID leans right and is not a bloc: 44% Republican, 29% Democratic, 27% independent. Democrats plus independents are 56%.
- Church is weekly for 44% of homeschool parents and never for 31%, almost the same never-attend rate as parents overall.
- School environment, not religion, leads the motive list: 83% important, 28% most important in 2022-23.
- Geography is a rate story and a count story at once. Pulse put Alaska at 16.15% in 2023-24; 2024-25 registration put North Carolina at 9.47% and Massachusetts at 1.21%.
- Most homeschool students are not a solo kitchen-table model. 29% use co-op, hybrid, or another setup, and 44% of homeschool households also use another school sector.
- Persistence is short for many families. About 20% of ever-homeschooled adults were home for one year; under 20% were home for all of K-12.
- Money is expanding and poorly understood. Only 22% of homeschool parents said they have public-fund access, and 25% did not know. Universal or near-universal choice programs existed in 13 states plus D.C. as of 2025.
- Choice programs can move students off the homeschool ledger. North Carolina homeschool enrollment fell 7.5% in 2025-26 as private enrollment rose 6.1%.
Frequently Asked Questions
A 2026 synthesis put 3.408 million homeschool students in 2024-25, or 6.262% of school-age children (range 3.067 million to 3.749 million). The 2022-23 federal household survey used a tighter definition and found 3.4%, or about 1.76 million. Pulse data from late 2024 put the homeschool share at 6.530%.
Reporting states grew at an average 4.9% in 2024-25, more than double the pre-pandemic pace of about 2%. 80% of those states posted a year-over-year increase, and 36% set record highs. South Carolina led that round at +21.5%.
The 2022-23 federal survey finds 29%, up from 25% in 1998-99. Pulse responses for the same period put the share near 40% (19% Hispanic, 12% Black, 2% Asian, 7% two or more or other). A 2024 parent survey found homeschool parents were 15% Hispanic, 10% Black, and 5% Asian.
In 2022-23, 83% of homeschool parents called school environment an important reason, and 28% called it the most important. Academic dissatisfaction was important for 72% and most important for 17%. Religious instruction was important for 53%, below moral instruction (75%) and family life (72%).
No. About 20% of ever-homeschooled adults were home for only one year, and under 20% were home for all of K-12. Among current homeschool students, 71% are full-time at home and 29% use a co-op, hybrid, or other setup. 44% of households with a homeschooled child also use another school sector.
Treat homeschooling as a standing slice of US K-12. It is not a 2020 leftover. The planning number is a band. Use about 1.76 million on the strict federal count. Use 3.408 million on the 2024-25 state-plus-Pulse synthesis. Reporting states still grew 4.9% in 2024-25. Record highs showed up in 36% of those states.
Do not build a catchment model or a curriculum line around one household type. Many students are home for a year or two, not for all of K-12. About 20% of ever-homeschooled adults were home for one year. Under 20% were home the whole way through. Nearly three in ten current homeschool students use a co-op, hybrid, or other setup. About 44% of homeschool households also have a child in another sector.
Check your state’s ledger before you copy last year’s registration figure into next year’s forecast. ESA and voucher programs can move a student off the homeschool list and onto a private or account roll. North Carolina showed that split in 2025-26. Homeschool enrollment fell 7.5%. Private enrollment rose 6.1%. Ask two questions first. How does this state count hybrid and ESA students? Which survey are you quoting, the federal household file or the broader synthesis? For district-level demographic analysis or inquiries, reach out through our research desk contact page.
Sources and editing
This article cites state departments of education, the National Center for Education Statistics (NCES), U.S. Census Bureau Household Pulse surveys, and peer-reviewed research.
We may use AI tools to sort tables or improve wording. A human reviewer checks the numbers, citations, and claims before publication.
