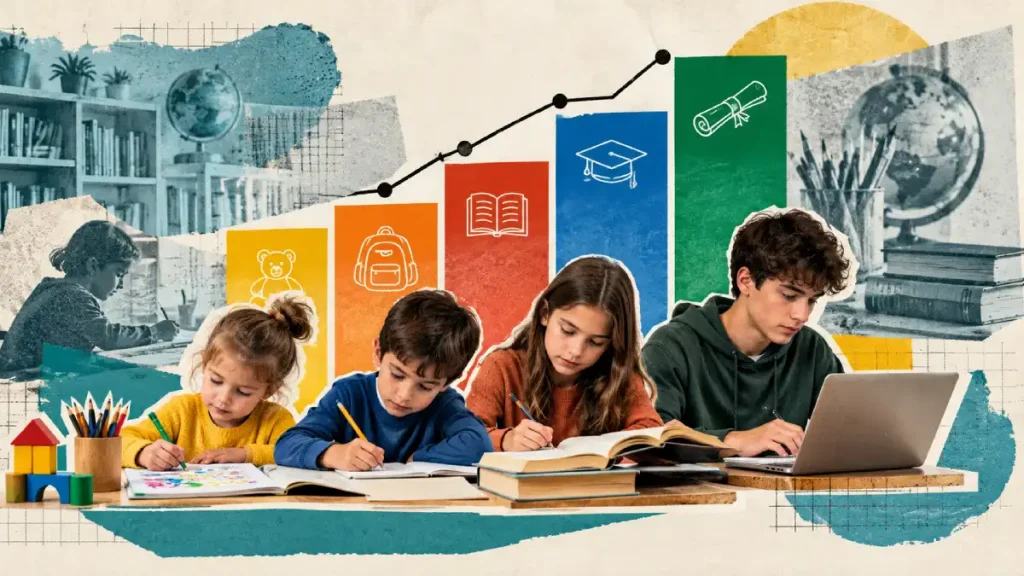
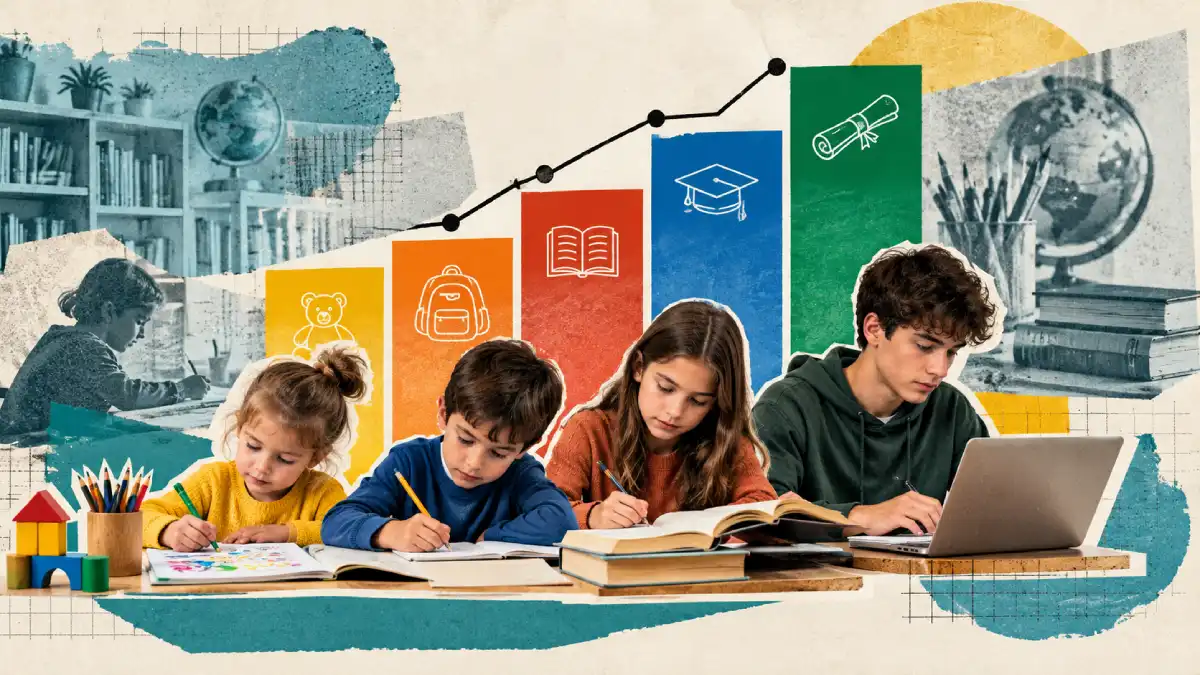

A parent finishes reading lessons with a six year old at the kitchen table in ninety minutes. Across town, another family withdraws an eighth-grader to rebuild algebra skills away from daily classroom friction. Both choices reflect how modern home education splits across age groups.
U.S. homeschool enrollment by grade level shows that family routines, academic pacing, and daily schedules change as children grow. The verified data below tracks student distributions, daily hours, and subject milestones from kindergarten through high school graduation.
Middle school represents the largest concentrated share
Typical range from elementary through high school
Reported national test percentile range
Share of upperclassmen completing college courses
Overall K-12 Grade Distribution and Demographic Breakdown
Grade level enrollment in home education follows a balanced distribution across primary and secondary tiers. While elementary grades build foundational literacy, middle school accounts for the largest concentrated share of home-educated students. State registry databases confirm consistent participation across rural, suburban, and urban communities.
- National estimates place total K-12 homeschool enrollment between 3.4 million and 3.7 million students in 2026.
- This population represents approximately 6.0% to 6.7% of all school-age children in the United States.
- Federal survey baselines from parent involvement data count a core full-time homeschooling rate of 3.4%, which equals roughly 1.9 million children under strict non-hybrid reporting criteria.
- Early elementary grades show steady adoption, with kindergarten through 2nd grade capturing 21% to 24% of the total homeschool population.
- Upper elementary grades continue this stability, as 3rd through 5th grade students make up 23% to 26% of all active homeschoolers.
- Middle school marks the highest single concentration across grade bands, with 6th through 8th grade holding 26% to 29% of the national homeschool count.
- High school grades 9 through 12 represent 22% to 25% of students, reflecting modest attrition as older teens enter technical programs or dual-credit tracks.
- State registries reflect these proportions clearly; Arkansas records over 32,000 registered homeschoolers, representing 6.7% of state student enrollment, while Wisconsin records over 26,000 students with 68% situated in grades 1 through 8.
- Demographic shifts have diversified home classrooms, with Black household participation stabilizing at 8.0% to 10.3% and Hispanic student participation reaching 12.1%.
- Rural districts maintain the highest per-capita homeschool rate at 4.4%, while suburban neighborhoods supply the largest raw volume at 41% of all home-educated children.
Kindergarten and Early Childhood Homeschool Entry Trends
Early childhood home education allows parents to match academic instruction to a child’s developmental readiness. Many families use home kindergarten to provide targeted phonics instruction while delaying long hours of sedentary desk work. State attendance laws grant parents wide discretion during these early years.
- Exactly 19 states and the District of Columbia mandate kindergarten attendance, leaving compulsory enrollment to begin at age 6, 7, or 8 across 31 states.
- Academic redshirting affects 4.0% to 5.5% of kindergarten-eligible children nationally, but jumps to 10% among boys with late summer birthdays.
- Research from university policy centers shows that roughly 40% of long-term homeschoolers begin their home education journey during kindergarten.
- Formal preschool accounts for only 12% to 15% of declared homeschool starts, because parents generally treat ages 3 and 4 as unstructured early play.
- In parent curriculum surveys, 38.7% of teaching parents select synthetic phonics programs as their primary tool for early literacy instruction.
- Literature read-aloud routines serve as the primary teaching path for 14.5% of early childhood families, while 12.7% rely on print immersion.
- Kindergarten homeschoolers average between 30 minutes and 2 hours of formal seat work each day.
- Roughly 68% of home-educated five-year-olds master three-letter phonetic blending before mid-year, demonstrating the speed of direct individual practice.
Lower Elementary (Grades 1-3) Foundational Learning Statistics
The primary grades establish core capabilities in reading decoding, penmanship, and basic mathematical operations. One-on-one instruction eliminates the downtime common in conventional classrooms. As a result, primary students achieve strong academic mastery in fewer daily hours.
- Daily seat work in 1st grade averages 1.0 to 1.5 hours, rising to 1.5 to 2.5 hours in 2nd grade and 2.0 to 3.0 hours in 3rd grade.
- Total weekly instruction for lower elementary ranges from 7.5 to 12.5 hours, matching the academic output of a 30-hour public school week.
- Standardized reading assessments place lower elementary homeschoolers between the 79th and 87th percentile, outperforming public school medians by 29 percentile points.
- Math scores in primary grades mirror this advantage, with home-educated 2nd and 3rd graders scoring 25 percentile points above conventional classroom averages.
- Oral reading fluency assessments show 1st grade homeschoolers consistently meeting or exceeding the 75th percentile benchmark of 91 words per minute.
- Spring assessments for 2nd grade home students record average reading fluency between 100 and 124 words per minute.
- Parents invest between 12 and 18 hours weekly to prepare lessons, review worksheets, and deliver direct one-on-one phonics instruction.
- Curriculum completion rates reach 82% to 88% per grade level, as parents bypass 15% to 20% of repetitive drills once a child masters a concept.
Upper Elementary (Grades 4-5) Pacing and Subject Mastery
Upper elementary marks a critical developmental transition from learning to read toward reading to learn. Students begin tackling textbooks in history and science while expanding their capacity for independent study. Mastery based progression ensures that children fully understand mathematical concepts before moving forward.
- Approximately 25% to 28% of 4th and 5th grade homeschool students work at least one full grade level ahead in at least one core subject.
- Advanced reading placement leads subject acceleration, with 31% of upper elementary students tackling literature above their chronological age.
- Daily instruction schedules expand to 2.5 to 3.5 hours per day, totaling 12.5 to 17.5 hours of focused study per week.
- Independent student work increases sharply from 15% of daily tasks in early elementary to 45% or 55% by 5th grade.
- Transition data reveals that 84% of 4th grade homeschoolers complete direct decoding drills and move fully into reading for history, science, and literature.
- Mastery-based math adoption reaches 62% among 4th and 5th grade families, requiring children to score 85% to 90% on chapter tests before advancing.
- Standardized test results place upper elementary students in the 84th to 88th percentile for reading comprehension and text analysis.
- Only 6% to 8% of upper elementary homeschoolers perform below nominal grade level, and most of these learners receive customized instruction for diagnosed learning differences.
Middle School (Grades 6-8) Transition Dynamics and Enrollment Spikes
Middle school serves as the primary intake window for families leaving traditional school systems. Parents often seek a calmer learning environment to protect children from peer hostility and social media pressures.
At the same time, academic expectations rise as students prepare for high school algebra and laboratory sciences.
- Middle school represents the peak enrollment window in U.S. home education, holding 26% to 29% of all homeschooled students nationwide.
- The 6th grade transition generates the largest single annual entry point, accounting for 18% to 22% of all first-time homeschool registrants.
- Traditional middle school bullying rates hit 28% nationally, prompting 78% to 82% of transition families to cite peer hostility as their primary withdrawal reason.
- Smartphone culture and digital social friction influence 64% of families who pull their 6th or 7th graders out of traditional schools.
- Academic pacing dissatisfaction motivates 61% to 68% of middle school parents, who report that public classrooms move too slowly or suffer frequent behavioral disruptions.
- Daily instructional schedules expand to 3.5 to 5.0 hours per day, with students completing 65% to 75% of assignments independently.
- Advanced mathematics progression accelerates, as 32% to 36% of 8th grade homeschoolers complete Algebra 1, compared to roughly 24% in traditional public schools.
- Retention rates stay strong across middle school, with more than 65% of students who enter home education in 6th grade continuing through 8th grade.
High School (Grades 9-12) Retention and Enrollment Patterns
Homeschooling high school requires structured planning for credit distribution, standardized testing, and post-secondary admissions.
Some students return to public schools for sports or vocational labs. Most secondary home learners remain on an independent graduation track.
- High school students represent 22% to 25% of the national homeschool population, totaling roughly 750,000 to 900,000 teenagers in 2026.
- The transition from 8th grade to 9th grade sees an enrollment dip of 20% to 25% as families reassess graduation requirements.
- State registry records in Wisconsin show secondary students in grades 9 through 12 comprise 29% to 32% of all home-based educational filings.
- Interscholastic athletic rules prompt 42% of returning public high school freshmen to leave home education to access varsity sports teams.
- Advanced laboratory science equipment and specialized language instruction motivate 38% of families who return to traditional schools at 9th grade.
- Late entry from traditional high schools into home education accounts for 14% to 17% of new secondary homeschool registrations.
- Chronic academic anxiety and classroom fatigue drive 68% of parents who withdraw students during 10th or 11th grade.
- Official parent-issued high school transcripts now achieve a 98% acceptance rate among accredited U.S. post-secondary institutions.
Dual Enrollment and College Credit Accumulation in High School
Dual enrollment has become a standard strategy for homeschooled upperclassmen seeking external academic validation. By completing introductory community college courses during high school, students demonstrate collegiate capability while lowering future undergraduate tuition expenses.
- Nationwide dual enrollment participation grew from 1.5 million students in 2021 to over 2.8 million high schoolers by 2024.
- Approximately 46% to 52% of homeschooled high school juniors and seniors complete at least one college course before graduation.
- Homeschooled dual enrollment students earn an average of 15 to 24 transferable college credits while finishing high school requirements.
- Roughly 18% of dual-enrolled homeschool seniors graduate with an Associate of Arts or Associate of Science degree alongside their diploma.
- Families spend between $65 and $180 per college credit hour when dual enrollment courses lack state or district subsidies.
- College admissions offices view 2 to 4 dual enrollment courses as sufficient third-party proof to validate parent-assigned high school grades.
- Advanced Placement (AP) exam test-takers among homeschoolers achieve a 72% pass rate with scores of 3 or higher.
- Classic Learning Test (CLT) adoption grew 35% year-over-year, providing an alternative testing pathway accepted by hundreds of colleges.
Standardized Testing and Academic Performance Across Grade Bands
Standardized evaluations consistently document higher performance percentiles for home-educated students across elementary, middle, and high school grades. These outcomes appear consistently across differing demographic backgrounds and parental education brackets.
- Homeschooled high school test-takers achieve an average SAT score of 1190, surpassing the national public school average of 1050 by 140 points.
- Composite ACT results for home-educated seniors average 22.8 to 24.5, compared to the national composite average of 19.4.
- Standardized assessments like the Stanford 10 place home-educated students in the 85th to 87th percentile across all grade bands.
- Elementary homeschoolers score 15 to 29 percentile points above national public school medians in standardized reading.
- Middle school homeschool test-takers outscore conventional classroom averages by 22 percentile points in mathematics computation.
- Longitudinal testing data confirms that homeschoolers score 1 to 3 grade levels ahead of age-peers across reading comprehension.
- The performance margin remains constant across household income brackets, with low-income homeschoolers scoring in the 80th percentile on basic skills.
- Parent educational credentials show minimal impact on outcomes, as children of non-college parents still average in the 83rd percentile.
Daily Instructional Hours and Schedule Efficiency by Grade Level
Instructional schedules in home education reflect significant efficiency compared to institutional classrooms. Homeschooling eliminates corridor transitions, attendance calls, and group discipline. Students cover equivalent academic material in a fraction of the time.
- Focused academic instructional time in kindergarten requires 30 minutes to 2 hours per day.
- Lower elementary students in grades 1 through 3 average 1.5 to 2.5 hours of focused study daily.
- Upper elementary students in grades 4 and 5 spend 2.5 to 3.5 hours each day on core academic subjects.
- Middle schoolers in grades 6 through 8 average 3.5 to 5.0 hours of daily academic instruction.
- High school students in grades 9 through 12 complete 4.5 to 6.5 hours of study daily, including lab work and lectures.
- Public school classroom time audits reveal that only 2.5 to 3.5 hours of a standard seven-hour school day involve direct instruction.
- A four-day school week schedule serves 35% to 40% of homeschooling families, reserving the fifth day for co-ops or internships.
- High schoolers complete 70% to 80% of their coursework independently, cutting direct parental instruction time to 3 to 5 hours weekly.
Neurodivergent and Special Education Participation by Grade Band
Home education attracts a significant share of families managing neurodivergence, attention differences, and sensory processing needs. Parents tailor daily schedules and sensory environments to individual children, bypassing the rigid constraints of overcrowded special education rooms.
- Between 25% and 38% of homeschooling families educate at least one child with identified special learning needs or neurodivergence.
- Approximately 1 in 10 children with autism in the United States receives education at home rather than in a conventional classroom.
- Attention-deficit/hyperactivity disorder (ADHD) affects 16% to 20% of home-educated children, representing the most common neurodivergent diagnosis.
- Dyslexia and related reading differences account for 12% to 15% of identified special learning needs among elementary homeschoolers.
- A significant 36% of students with disabilities enter homeschooling as a secondary choice after experiencing academic failure in public schools.
- Middle school grades 6 through 8 register the highest rate of special education transitions, as Individualized Education Program support breaks down.
- Individualized pacing allows neurodivergent homeschoolers to make an average of 1.4 grade equivalents of reading progress per academic year.
- Reducing sensory overload and social anxiety at home cuts emotional distress behaviors by 65% within six months of withdrawal.
Annual Curriculum and Extracurricular Costs Across Grade Tiers
Direct expenditures for home education scale upward as students progress through the academic grades. Elementary families keep costs modest through library materials and reusable workbooks. High school adds specialized software, lab supplies, and college credits.
- Annual homeschooling costs average between $700 and $1,800 per student across all K-12 grade levels.
- Elementary school education remains the most affordable tier, averaging $1,295 per student annually for basic workbooks and readers.
- Families operating on tight budgets educate elementary students for $300 to $600 per year by utilizing public libraries and free curriculum resources.
- Middle school education expenses rise to an average of $1,636 per year as coursework incorporates specialized software and online tutoring.
- High school homeschooling costs range from $1,500 to $3,500 or more per student each year, driven by lab equipment, test fees, and online instructors.
- Homeschool co-op registrations cost families between $25 and $150 per term, with specialized classes running $15 to $80 monthly.
- Specialized high school science kits and lab supplies require an additional investment of $150 to $350 per course.
- Reusable textbooks and shared literature packages reduce per-child curriculum costs by 30% to 45% in multi-child households.
School Choice, ESA Vouchers, and Microschool Adoption by Grade
Education savings accounts and legislative school choice expansions have altered the financial dynamics of home education. Thousands of families now use state-funded educational accounts to purchase accredited curricula, therapeutic interventions, and part-time microschool instruction.
- Universal Education Savings Account (ESA) policies now operate in 12 states, distributing public education funds directly to qualifying families.
- State ESA award values range between $6,500 and $8,500 per student each school year for general education expenses.
- Arizona ESA scholarship accounts disburse roughly $7,000 to $8,000 annually per pupil, serving more than 100,000 students statewide.
- Florida Family Empowerment Scholarships provide between $7,800 and $8,500 per pupil across elementary and secondary grade bands.
- Specialized disability ESA awards exceed standard amounts, reaching up to $10,000 in Florida and over $25,000 in Arizona.
- More than 1.5 million students attend hybrid homeschool academies and micro-schools meeting two to three days per week.
- Elementary learners represent 58% of micro-school enrollment, as parents seek early peer interaction without full-time institutional schedules.
- Arkansas Educational Freedom Accounts reached universal eligibility for the 2025-2026 school year with baseline awards of $6,864 per student.
High School Graduation, College Matriculation, and Career Outcomes
Long-term tracking reveals strong post-secondary outcomes for home-educated graduates. From college degree completion to civic participation, homeschool alumni demonstrate solid academic foundations and high degrees of adult autonomy.
- Approximately 74% of homeschooled high school graduates matriculate into college, compared to 46% of national public school graduates.
- College acceptance rates for home-educated applicants average 87% across four-year accredited colleges and universities.
- Home-educated college students achieve an average freshman grade point average of 3.46, compared to the national university average of 3.16.
- Four-year college degree completion rates reach 66.7% for homeschool alumni, outperforming the national public school cohort average of 57.5%.
- Civic engagement surveys record that 71% of home-educated adults participate in local community service groups, compared to 37% of the general population.
- Voter participation among adult homeschool graduates reaches 76% in general elections, outpacing the national youth turnout average of 51%.
- Self-employment and entrepreneurship rates are twice as high among homeschool graduates, with 18% owning or running a business.
- Employer surveys indicate that 82% of hiring managers rate homeschool alumni as highly capable of independent work and self-directed task management.
Recent Developments
State legislative reforms, automated learning tools, and database adjustments have shaped the homeschooling environment in 2025 and 2026. These developments reflect the continuing integration of home education into mainstream educational policy.
- In 2025 and 2026, 12 states expanded universal school choice, allowing families to allocate state education funds toward home instruction.
- Artificial intelligence learning tutors reached a 48% adoption rate among homeschool families in grades 6 through 12.
- State education departments updated registry files in 2025, with North Carolina removing 6,690 inactive files to refine baseline homeschool counts.
- Hybrid homeschool co-ops grew by 18% year-over-year, establishing shared classrooms for secondary sciences and foreign languages.
- Digital curriculum publishers reported a 27% shift toward adaptive, competency-based learning platforms over fixed-year textbook bundles.
- Micro-school networks expanded across suburban markets, with enrollment growing 22% between the 2024 and 2026 academic years.
- Legislative protection bills passed in 7 states to prevent local districts from restricting homeschool access to college dual-credit funding.
- Post-pandemic enrollment numbers stabilized between 3.4 million and 3.7 million students, confirming home education as an established educational choice.
- Early grades: Short focused lessons build literacy and numeracy foundations
- Middle school: Enrollment rises as families seek mastery pacing and calmer environments
- High school: Credit planning and college coursework shape independent graduation paths
Editor’s Choice
The following verified benchmarks highlight the most significant grade-level findings across the national home education sector in 2026.
- National home education enrollment holds between 3.4 million and 3.7 million students, representing 6.0% to 6.7% of school-age children in 2026.
- Middle school captures the largest single share of home learners, with grades 6 through 8 accounting for 26% to 29% of students.
- Homeschooled seniors outscore national SAT averages by 140 points, averaging 1190 against the national median of 1050.
- Dual enrollment credits shorten college paths, with 46% to 52% of home high schoolers completing accredited college courses before graduation.
- Standardized achievement exams place home students between the 85th and 87th percentile across all subject areas.
- Focused instructional efficiency allows elementary home students to match classroom academic progress in just 1.5 to 2.5 hours per day.
- Special education families represent 25% to 38% of the homeschool community, using customized pacing to overcome learning barriers.
- College graduation rates reach 66.7% for homeschool graduates, surpassing national college retention averages by 9.2 percentage points.
Frequently Asked Questions
Middle school holds the largest share, with grades 6 through 8 representing 26% to 29% of all 3.7 million home students. Grade 6 alone represents 18% to 22% of first time entries.
Kindergarteners require 30 minutes to 2 hours daily, while elementary students in grades 1 through 5 complete core work in 1.5 to 3.5 hours. Middle schoolers average 3.5 to 5.0 hours each day, and high school students spend 4.5 to 6.5 hours on academic study.
Home students score in the 85th to 87th percentile on nationwide achievement tests, outperforming the public school median of the 50th percentile by 35 to 37 percentile points. On college entrance exams, home seniors average 1190 on the SAT, beating the national average of 1050 by 140 points.
Between 46% and 52% of home educated high school juniors and seniors complete college courses before graduating. These students earn an average of 15 to 24 transferable college credits, with roughly 18% completing a full associate degree.
Elementary education averages $1,295 annually per student, while middle school expenses rise to $1,636 per year. High school costs range from $1,500 to over $3,500 annually per pupil due to laboratory science fees, online instruction, and college credit tuition.
Conclusion
Home education in 2026 functions as a flexible pathway across every academic stage. Kindergarten families emphasize early phonics and play, while middle school parents prioritize emotional safety and mastery pacing. By high school, teenagers take charge through dual college credits and independent study.
Standardized testing data, college matriculation numbers, and retention rates demonstrate that home education produces capable, self-directed learners. As education savings accounts and hybrid classrooms expand, families continue to customize learning to match individual student needs.
Sources and editing
This article cites state departments of education, the National Center for Education Statistics (NCES), U.S. Census Bureau Household Pulse surveys, and peer-reviewed research.
We may use AI tools to sort tables or improve wording. A human reviewer checks the numbers, citations, and claims before publication.