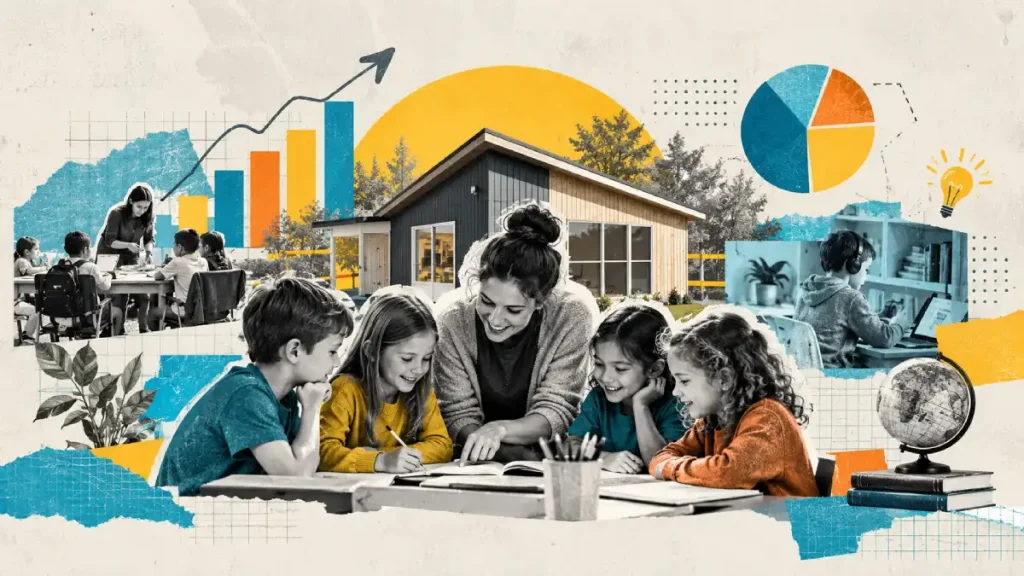

American K-12 education continues to decentralize. Microschools have evolved from emergency pandemic pods into a permanent alternative educational sector across the United States. Families increasingly seek individualized learning pacing, smaller class cohorts, and close community relationships. The following data compiles verified empirical benchmarks on national market scale, instructional models, educator backgrounds, operational costs, tuition rates, and state school choice legislation.
Microschools have expanded from temporary pandemic pods into a permanent fixture of American K-12 education. Families seek personalized pacing, small cohorts, and values-aligned learning environments. The following data presents empirical benchmarks across enrollment, instruction, operations, and state policy.
Students in an intimate learning community
Typical microschool enrollment
Reported annual tuition benchmark
Share reporting regional or state accreditation
Microsochool Position in the United States
- Over 1,500,000 American K-12 students attend microschools across all 50 states.
- An estimated 75,000 to 95,000 microschools operate nationwide in 2026.
- The sector serves between 2.0% and 3.8% of the entire United States school-age population.
- Average cohort sizes range between 8 and 16 students per microschool community.
- Classroom educators with prior public school teaching experience establish 71% of microschools.
- Over 66% of microschools actively enroll neurodivergent learners, including students with ADHD and autism.
- State school choice programs fund student tuition in 50% of operating programs.
- Median annual tuition stands at $6,500, roughly 59% lower than conventional public school per-pupil spending.
- Parent satisfaction reaches 97%, reflecting strong community confidence in personalized learning models.
US Microschool Market Scale and National Enrollment
The American microschool movement continues steady national expansion. Broad state school choice policies and parent demand for flexible education accelerate local cohort creation across rural, suburban, and urban communities.
- National microschool enrollment reached 1,500,000 students across the United States by early 2026.
- Between 75,000 and 95,000 independent microschools, learning pods, and micro learning centers operate nationwide.
- Microschool students represent roughly 3% of total United States K-12 school enrollment.
- The national microschool ecosystem expanded by 28% between 2024 and 2026.
- Over 120,000 students enroll in decentralized network platforms operating across multiple states.
- Rural communities host 22% of active microschools, providing options in areas with limited private alternatives.
- Urban neighborhoods account for 34% of active programs, while suburban districts host 44%.
- Sector growth forecasts project national student enrollment to reach 2,200,000 by 2028.
- States with universal Education Savings Accounts account for 58% of all new microschool launches.
Student-to-Teacher Ratios and Cohort Sizes
Low adult-to-student ratios define the operational structure of modern microschools. Educators deliver individual feedback while maintaining multi-age classroom dynamics.
- The average student-to-teacher ratio in American microschools stands at 10:1.
- Over 48% of micro classrooms maintain student-to-teacher ratios below 8:1.
- Conventional public school classrooms average a 16:1 student-to-teacher ratio nationwide.
- Median single-room cohort enrollment measures 16 students across full-time programs.
- Early-stage home pods limit total enrollment to 6 to 10 students per learning session.
- Multi-staff microschool centers rarely exceed 35 total enrolled students across all age bands.
- Multi-age grouping spans 2 to 4 traditional grade levels in 82% of micro classrooms.
- Guides provide an average of 45 minutes of direct 1-on-1 coaching per student daily.
- Small class sizes reduce daily discipline disruptions by 78% compared to traditional district schools.
Curriculum Frameworks and Pedagogical Priorities
Microschools combine modular, student-centered frameworks rather than single standardized textbooks. School founders design interdisciplinary learning schedules tailored to student passions.
- Microschool operators implement project-based learning frameworks across 72% of active programs.
- Self-directed learning models and learner-driven pacing guide daily instruction in 65% of schools.
- Over 58% of microschool programs incorporate explicit social and emotional skill development daily.
- Custom, nature-based, and outdoor study frameworks structure daily operations for 31% of microschools.
- Faith-centered instructional frameworks and religious curricula direct daily studies in 29% of classrooms.
- Montessori philosophies and tactile learning methods direct classroom work in 21% of microschools.
- Classical education curricula emphasizing the historic trivium govern academic schedules in 18% of sites.
- More than 300 micro campuses worldwide conduct daily Socratic discussions to build analytical reasoning.
- Program leaders blend two or more distinct instructional philosophies in 74% of active microschools.
AI Tutors and Adaptive Learning Software Adoption
Adaptive learning software and artificial intelligence tutors allow students to master core academic skills quickly. Teachers transition from lecture delivery to direct personal coaching and mentorship.
- Microschools assess daily academic progress through embedded software analytics in 50% of programs.
- Adaptive software models condense core math, reading, and science mastery into 2 hours daily.
- Students using adaptive digital platforms complete core grade-level material 2.3 to 6.5 times faster than traditional pupils.
- Adaptive platforms require students to achieve 80% to 90% mastery before unlocking advanced curriculum units.
- Students spend 4 or more hours daily on hands-on collaborative workshops, debates, and creative builds.
- Tech-forward microschools maintain a 1:1 student-to-device ratio across more than 85% of campuses.
- Educators in tech-enabled micro classrooms spend less than 15% of their day delivering whole-group lectures.
- Guides dedicate over 80% of instructional hours to individual coaching, goal review, and student support.
- Automated learning dashboards identify academic comprehension stalls within 24 hours, accelerating targeted teacher interventions.
Student Assessment Methods and Portfolio Mastery
Most microschools replace traditional letter grades with continuous mastery evaluations. Educators measure student growth through demonstrated competency, portfolio defenses, and structured observations.
- Only 29% of microschools issue traditional A-to-F letter grades on student progress reports.
- Non-traditional evaluations, skill badges, and competency milestones measure student progress across 71% of programs.
- Over 67% of micro operators maintain systematic direct observation logs to document student skill development.
- Mastery-based tracking platforms evaluate continuous competency gains in 51% of microschool environments.
- Student project portfolios serve as primary assessment instruments across 48% of operating programs.
- Standardized norm-referenced or criterion-referenced examinations take place in 36% of microschools.
- An additional 9% of programs administer standardized tests only upon specific parental request.
- Over 60% of programs conduct student-led parent conferences 2 to 4 times each academic year.
- Public project exhibitions and capstone defense panels determine course advancement in 42% of schools.
Academic Gains and Standardized Testing Data
Standardized academic growth measurements demonstrate accelerated learning gains in mastery-based environments. Diagnostic evaluations reveal rapid grade-level advancements for students entering behind benchmark.
- Students in mastery-based micro networks achieve an average of 1.35 years of academic growth annually.
- Students entering with Individualized Education Programs record 1.18 years of annual growth in micro classrooms.
- Standardized benchmark testing shows 47% of microschool students exceeding projected national annual growth in reading.
- Mathematics assessments reveal that 37% of participating micro students surpass national expected annual gains.
- Over 30% of students entering multiple grade levels behind achieve grade-level proficiency within 1 school year.
- By the end of each academic cycle, 70% of enrolled students perform at or above grade level.
- Longitudinal tracking across micro networks demonstrates a 35-percentage-point increase in intrinsic student motivation.
- Independent national testing databases identify paired fall-to-spring standardized test data for fewer than 0.1% of microschools.
- Over 90% of micro high school graduates transition directly into colleges, vocational apprenticeships, or entrepreneurial ventures.
Neurodiverse Learners and Special Education Services
Microschools have become a primary destination for neurodivergent children. Small cohort environments, sensory accommodations, and self-paced schedules provide support that large public schools often struggle to deliver.
- Nearly two-thirds (66%) of American microschools actively enroll neurodivergent students, including children with autism, ADHD, and dyslexia.
- Over 50% of microschool founders report launching their programs specifically to serve children unsupported by conventional district schools.
- Approximately 31% of enrolled microschool students possess an official Individualized Education Program or Section 504 plan from prior districts.
- Sensory-friendly classrooms and flexible spatial layouts accommodate neurodiverse learning profiles in 68% of micro facilities.
- Surveys indicate 97% of parents report overall satisfaction with micro classrooms, compared to 38% in prior public placements.
- Over 93% of parents state that their neurodivergent children actively want to attend school each day.
- Independent microschools operate outside federal Individuals with Disabilities Education Act requirements in over 80% of private jurisdictions.
- Families coordinate external speech therapy, occupational therapy, or behavioral support independently across 58% of private microlearning programs.
- Small cohort sizes of 5 to 8 students allow guides to personalize sensory and cognitive pacing daily.
Founder Demographics and Educator Backgrounds
Professional educators establish the vast majority of American microschools. Teachers leave large public school systems to pursue instructional autonomy, smaller class sizes, and meaningful community relationships.
- Professional educators and youth development leaders launch 86% of all operating microschools.
- Classroom teaching veterans establish 71% of microschools, including 38% holding active teaching licenses.
- Former classroom teachers with expired licenses manage 33% of established microlearning sites.
- Entrepreneurs, parents, and community organizers without formal school licenses establish 30% of programs.
- Founders serve directly as lead teachers inside classroom cohorts across 46% of schools.
- White educators account for 64.4% of active microschool operators across the country.
- Black educators establish 12.9% of active microschools, while Hispanic educators account for 5.0% of sites.
- Prospective founder cohorts reflect rising diversity, with 37% identifying as people of color.
- Grant-funded community programs report that over 50% of site leaders identify as racial minorities.
- Founders enroll their own school-age children within their daily micro classrooms in 30% of programs.
Guide Compensation and Staffing Models
Microschools employ lean staffing models with simplified operational layers. Learning guides trade corporate administrative mandates for higher instructional autonomy, lower stress, and direct student connections.
- Network microschool operators pay full-time classroom guides base salaries ranging from $36,000 to $60,000 annually.
- Part-time micro instructors and specialist mentors earn average hourly wages between $16.00 and $26.00.
- Conventional public school districts pay teachers an average annual salary of $69,544.
- Decentralized platform models provide $0 in base pay, distributing $1,200 to $3,500 per enrolled student annually.
- Microschool guides report an overall job satisfaction rate of 97%, with 76% reporting high daily fulfillment.
- Only 35% of microschool guides experience moderate or severe workplace stress during the school year.
- Low or negligible occupational stress characterizes the daily work environment for 65% of micro educators.
- Over 71% of guides actively recommend the teaching role to colleagues leaving conventional public schools.
- Independent operators employ volunteer parents or part-time aides for 10 to 15 hours weekly.
Annual Tuition Rates and Cost-to-Educate Benchmarks
Microschool tuition remains significantly lower than traditional private day schools. Low physical overhead and minimal administrative staffing keep education affordable for working families.
- The median annual cost to educate a student in an American microschool stands at $6,500.
- National annual tuition averages range between $6,200 and $8,500 across independent non-charter microschools.
- Over 42% of microschools charge less than $5,000 annually, maintaining accessibility for working-class families.
- Tuition rates fall between $5,000 and $10,000 annually across 32% of operating micro campuses.
- Only 14% of specialized or high-tech microschools set annual tuition above $12,000.
- Conventional public school districts spend an average of $16,000 per pupil annually, roughly 2.4 times higher than median micro costs.
- Over 66% of microschools provide sliding-scale tuition discounts or need-based scholarships to enrolled students.
- Direct parent tuition payments serve as the primary revenue foundation for 60% of microschool operators.
- Tuition-free charter-authorized microschools educate approximately 12% of all micro-enrolled students nationwide.
State School Choice Programs and Education Savings Account Funding
State education choice policies have transformed microschool financing across the United States. Families utilize state education savings accounts and tax-credit scholarships to fund full tuition expenses.
- State legislatures maintain 21 distinct Education Savings Account programs across 18 states as of 2026.
- Lawmakers have enacted universal or near-universal school choice eligibility across 13 state jurisdictions.
- State-funded private school choice programs currently enroll 2.8% of all United States K-12 students.
- Annual public investment in state education choice initiatives now surpasses $10.8 billion nationally.
- Families utilize state Education Savings Accounts or tax-credit scholarships to fund tuition in 50% of microschools.
- Average annual Education Savings Account vouchers provide between $7,000 and $9,000 per eligible child.
- State voucher allocations completely cover baseline annual tuition fees for over 68% of participating microschool families.
- A leading Southwest universal voucher program enrolls more than 100,000 students, with 18% attending micro environments.
- A Southeast personalized education program reached its statutory limit of 60,000 students, expanding capacity toward 140,000.
Weekly Schedules and Hybrid Operating Calendars
Flexible operating schedules represent a major attraction for modern homeschool and microschool families. Programs customize weekly attendance days to balance direct instruction with independent exploration.
- Over 52% of American microschools operate on a 4-day weekly instructional schedule.
- Hybrid schedules featuring 2 or 3 in-person days per week represent 31% of operating programs.
- Traditional 5-day school calendars remain in place across only 17% of surveyed microschools.
- Core academic instruction averages 4.5 to 5.5 hours per day across active learning sites.
- Year-round balanced calendars with 6-week learning blocks occur in 28% of micro operations.
- Friday enrichment programs or independent project days feature in 64% of 4-day microschool models.
- Over 70% of hybrid microschools align attendance schedules with local homeschool co-op meeting days.
- Annual instructional hours average between 720 and 900 hours, meeting state minimum education requirements.
- Attendance compliance rates in flexible-calendar microschools exceed 94% across all age cohorts.
Physical Facilities and Operating Locations
Microschools occupy shared commercial, civic, and residential spaces rather than purpose-built institutional buildings. Operating in adaptive spaces drastically lowers facility overhead.
- Commercial storefronts and shared office suites host 38% of operating United States microschools.
- Churches and faith-based community spaces lease educational facilities to 29% of active programs.
- Residential living rooms, converted garages, and home spaces house 21% of early stage microschool pods.
- Makerspaces, public libraries, and community recreation centers accommodate 8% of hybrid learning cohorts.
- Outdoor nature preserves and working farmsteads host 4% of dedicated forest microschool programs.
- Average instructional square footage per enrolled student measures between 45 and 65 square feet.
- Monthly facility lease costs average between $1,200 and $3,400 for independent micro locations.
- Over 62% of microschool founders negotiate shared facility leases that permit weekend community use.
- Facility access disputes or unexpected lease terminations cause 38% of premature program relocations.
Legal Classifications and State Operating Status
Microschools navigate varied regulatory structures depending on state statutes. Programs register as recognized private schools, umbrella homeschool cooperatives, or licensed childcare entities.
- Recognized private independent schools account for 56% of legally registered microschools.
- Homeschool hybrid cooperatives and parent-led learning pods represent 31% of active operations.
- Tuition-free public charter school satellites and district-authorized hybrids comprise 9% of programs.
- Licensed daycare or child care center classifications apply to 4% of early childhood micro programs.
- Over 68% of microschools operate without mandatory state curriculum approval requirements.
- Formal attendance reporting to state education agencies occurs in 44% of micro jurisdictions.
- States with formal legal definitions for learning pods and micro learning centers expanded to 11 in 2026.
- Over 73% of operators consult specialized legal counsel to structure entity filings and liability disclaimers.
- Parent-directed private status protects instructional autonomy in 89% of independent micro operations.
Zoning Ordinances, Building Codes, and Permitting Hurdles
Municipal zoning restrictions remain the most complex barrier to opening physical microschools. Local building departments often attempt to impose commercial school occupancy mandates on small neighborhood cohorts.
- Municipal zoning reviews cause startup delays for 64% of founders seeking dedicated physical spaces.
- Standard institutional educational occupancy codes add between $15,000 and $75,000 in renovation expenses.
- Commercial automatic fire sprinkler retrofits cost founders an average of $12,000 to $45,000.
- Municipal parking minimums and drop-off traffic mandates delay site approvals for 41% of programs.
- Three states enacted statutory exemptions protecting microschools from commercial assembly building codes.
- Conditional use permit applications require an average review window of 4 to 9 months across metropolitan zones.
- Over 35% of early-stage microschools choose home locations specifically to bypass commercial permitting delays.
- Municipal zoning citations forced temporary closures or relocation for 19% of surveyed facilities.
- State legislation restricting municipal zoning overreach on small educational entities exists in 6 states.
Accreditation Rates and Alternative Pathways
Most microschools operate without traditional regional accreditation. Emerging micro-specific accreditation frameworks offer streamlined validation without heavy bureaucratic compliance costs.
- Formal regional or state agencies accredit only 22% of active American microschools.
- Independent operators run 78% of microschool programs without conventional accreditation credentials.
- Sector research across state jurisdictions shows unaccredited operating rates ranging from 67% to 84%.
- Unaccredited program founders actively pursue approved credentials at an 87% rate to access state education funds.
- Traditional school accreditation reviews require 6 to 18 months and cost between $5,000 and $15,000.
- The Next Generation Accreditation model lowers initial evaluation expenses to $1,200 for independent operators.
- Candidate microlearning programs secure provisional accreditation determinations within 6 months of operational launch.
- Annual membership dues under specialized micro-accreditation standards range from $650 to $775 per facility.
- More than 40 alternative education networks joined pilot cohorts for agile accreditation protocols through 2025.
Startup Capital, Philanthropic Grants, and Venture Investment
Grassroots philanthropic funding and founder savings finance most independent microschool launches. Institutional venture capital concentrates primarily on scalable software platforms and franchised network backbones.
- Founders require an average startup capital investment between $10,000 and $35,000 to launch an independent microschool.
- Personal savings and private family contributions fund initial launch costs for 62% of education entrepreneurs.
- A major national education philanthropic fund has awarded over 2,000 grants totaling more than $24 million.
- Philanthropic microgrants provide early-stage classroom founders with seed awards ranging from $2,500 to $10,000.
- Secondary expansion grants offer up to $50,000 for established micro operators expanding physical cohort capacity.
- Large-scale bridge grants provide up to $250,000 for regional learning networks scaling shared operational systems.
- Venture capital firms and angel investors have deployed more than $175 million into microschool operating platforms and software.
- A prominent microschool operating platform secured $88.2 million in cumulative venture backing, including a $20 million Series B round.
- Specialized micro incubator platforms raised $18.7 million in venture funding to streamline regulatory filings and curriculum delivery.
Operating Longevity and Financial Sustainability
Financial sustainability in microschools relies on steady student retention and disciplined expense management. Single-guide programs achieve financial breakeven with modest student counts.
- Sector tracking confirms 65% of American microschools have operated continuously for 3 or more years.
- Mature programs operating for 6 or more years represent 20% of the active microschool market.
- Mid-stage programs in operation for 3 to 5 years comprise 45% of active micro facilities.
- New micro programs in their initial launch year account for 16% of operating learning communities.
- Single-guide micro classrooms achieve operational breakeven with an enrollment of 8 to 15 students.
- Sustainable microschools maintain average operating surplus margins between 8% and 15% annually.
- Loss of physical leased facilities causes 38% of observed microschool program closures.
- Founder isolation and operational fatigue trigger 34% of program shutdowns within the first two operating years.
- Enrollment drops below the critical 8-student threshold account for 28% of microlearning closures.
Recent Developments
The legislative and regulatory environment for American microschools evolved rapidly through 2025 and 2026. Landmark court decisions, state zoning reforms, and universal school choice expansions protect grassroots educational freedom.
- Lawmakers in 12 states introduced or expanded universal school choice legislation during the 2025 and 2026 legislative cycles.
- A major southern state established a universal education program launching in fall 2026 with an initial projection of 100,000 students.
- Statutory adjustments in a leading southeastern state raised education savings account capacity from 60,000 to 140,000 students.
- Three states passed statutory zoning protections exempting micro programs serving fewer than 30 children from commercial code mandates.
- State judicial rulings affirmed the constitutional right of religious microschools to participate equally in public voucher disbursements.
- Interstate microschool networks expanded active operating locations by 26% between 2024 and 2026.
- Over 40% of new micro classrooms opened inside shared, mixed-use community spaces to curb overhead expenses.
- Public school districts in 4 states initiated formal partnership pilots, contracting micro operators to re-engage chronically absent students.
- State education departments created dedicated non-public innovation liaisons across 8 states to expedite regulatory filings.
- Small cohorts: Low student to teacher ratios support personalized feedback
- Flexible schedules: Full time and hybrid calendars serve different family needs
- Lean operations: Shared spaces and small teams reduce facility and staffing overhead
Editor’s Choice
The following standout figures summarize the defining operational, financial, and academic characteristics of the American microschool movement in 2026.
- Over 1,500,000 American K-12 students learn full-time or hybrid within microschools nationwide.
- An estimated 75,000 to 95,000 active microschools operate across all 50 states.
- The national student-to-teacher ratio in microschools averages 10:1, compared to 16:1 in conventional public schools.
- At $6,500, median microschool tuition costs 59% less than public district per-pupil spending of $16,000.
- Former classroom educators lead instruction across 71% of active microlearning communities.
- Over 66% of microschools educate neurodivergent children, achieving a parent satisfaction rate of 97%.
- State school choice programs distribute over $10.8 billion annually across 21 active state initiatives.
- Mastery-based micro students gain an average of 1.35 years of academic growth in reading and math annually.
Frequently Asked Questions
A microschool is an intimate learning community that educates small groups of 5 to 15 students with personalized instruction. These schools combine mixed age cohorts, flexible weekly schedules, and adaptive digital software to replace conventional one size fits all classrooms.
The median annual tuition for an American microschool is $6,500, with most programs charging between $5,000 and $10,000. This rate represents less than half the operational cost of traditional private schools and conventional public district per pupil spending.
Approximately 22 percent of microschools maintain regional or state accreditation, while 78 percent operate as non accredited private entities or homeschool cooperatives. Many unaccredited founders now pursue agile micro credentials like the Next Generation Accreditation protocol to access state scholarship programs.
Yes, families across 18 states with school choice laws can direct state Education Savings Account funds toward approved microschool tuition. Average annual voucher amounts between $7,000 and $9,000 completely cover full tuition for over 68 percent of participating families.
A typical microschool enrolls a median of 16 students, maintaining an adult to student ratio of 10 to 1. Total cohort enrollment rarely exceeds 35 students, ensuring personal daily coaching and minimal behavioral friction.
Conclusion
Microschools have transitioned from an experimental grassroots movement into a permanent alternative educational ecosystem. Expanding state policies, affordable tuition, and high family satisfaction secure long-term sector viability.
Sources and editing
This article cites state departments of education, the National Center for Education Statistics (NCES), U.S. Census Bureau Household Pulse surveys, and peer-reviewed research.
We may use AI tools to sort tables or improve wording. A human reviewer checks the numbers, citations, and claims before publication.