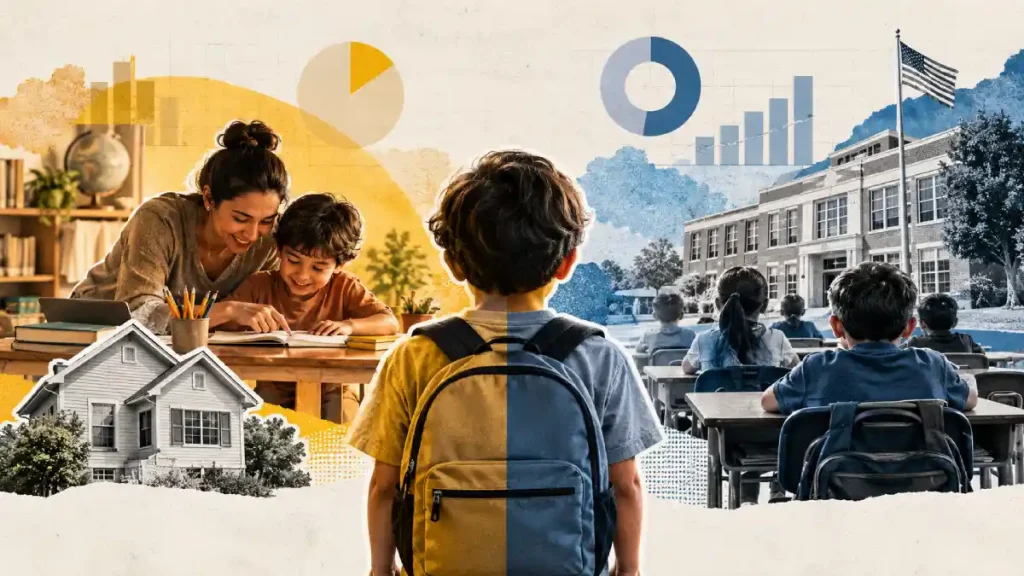
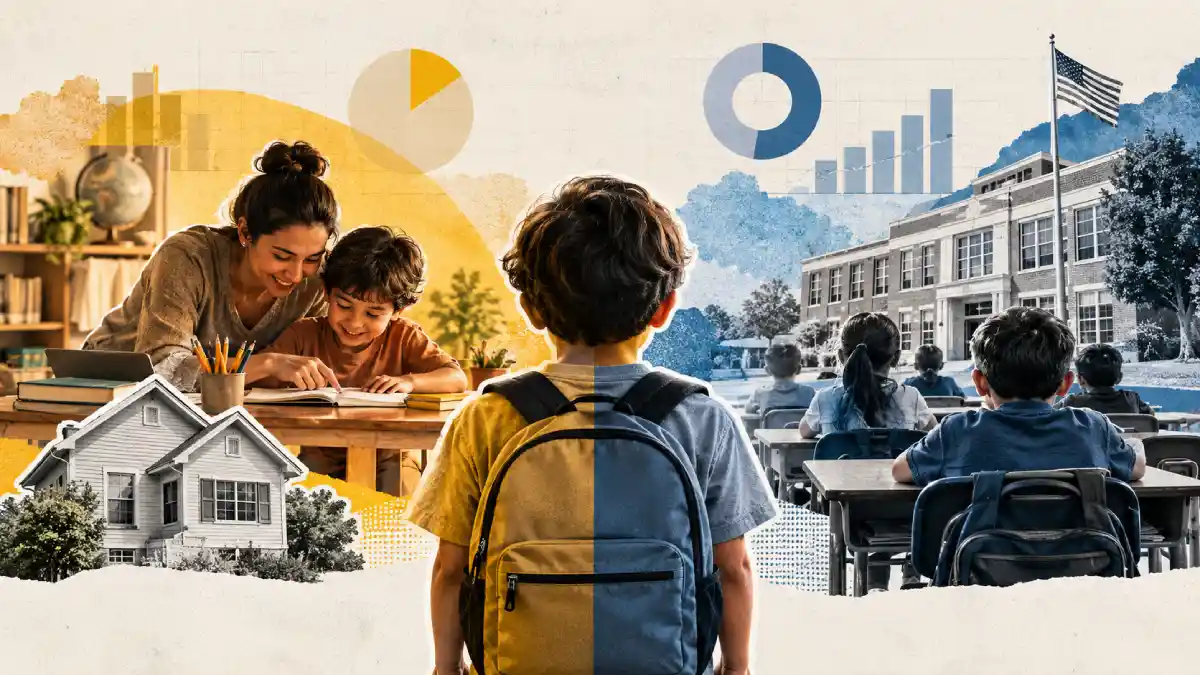

An Ohio school district just lost forty kindergarteners to parent-run neighborhood co-ops while an Atlanta mother claims an eight-thousand-dollar state scholarship account after district math proficiency stalled at twenty-four percent.
Across suburban subdivisions and rural counties, the division between traditional campuses and home study is fracturing standard district budgeting. Here are the verified statistics on academic mastery, family motivations, collegiate persistence, financial allocations, and long-term student outcomes.
Homeschool average on nationally normed standardized achievement tests
Estimated homeschool completion rate vs the 87% public four-year cohort rate
Homeschooling parents citing safety, drug exposure, or peer pressure as a reason
Home-educated students in 2026, up from 3.4 million in 2024
Subject-Level Competency in Reading, Math, and Science
- Reading comprehension evaluations place home-educated students at the 89th percentile on composite verbal indices, yielding their widest subject-level margin.
- In language arts, grammar, and written mechanics, home-taught pupils average at the 84th percentile versus the national median at the 50th percentile.
- Standardized mathematics assessments record homeschool students at the 82nd percentile, representing their lowest relative subject score while remaining 32 percentile points above the national average.
- General science batteries place home-educated test-takers at the 86th percentile, reflecting strong inquiry-driven mastery across biology and physical sciences.
- Social studies, history, and civic literacy assessments show home-educated students scoring at the 85th percentile nationally.
- In institutional high schools, 40% of graduating seniors meet or exceed college-readiness benchmarks in reading comprehension.
- District performance audits reveal that only 22% of graduating public seniors meet ACT readiness benchmarks across all four core subjects of English, reading, math, and science.
- Standardized spelling and vocabulary sub-tests register home-educated elementary pupils at the 87th percentile, attributed to early individualized phonetic reading instruction.
Parent Motivations, School Climate, and Dissatisfaction Rates
- Federal household surveys confirm that 80% of homeschooling parents cite concerns over school environments, including safety, drug exposure, and peer pressure, as an active reason for withdrawal.
- When asked to identify their single primary motivation, 25% of families identify adverse school environment as their deciding factor.
- Academic dissatisfaction with institutional school curricula prompts 73% of homeschooling families to leave public school districts.
- Dissatisfaction with classroom instructional quality represents the leading reason for 15% of home-educating households.
- Desire for family cohesion and customized character instruction influences 75% of home educators, with religious instruction cited by 13% as their primary reason.
- Surveys of public school staff indicate that 48% of district teachers report student behavioral disruptions interfering significantly with daily classroom lessons.
- School schedule rigidity and compulsory standardized testing cycles motivate 54% of parents to adopt flexible, self-paced home instruction.
- Among parents who removed children from public schools over the prior twenty-four months, 68% reported persistent school-related anxiety or chronic stress in their children before switching.
High School Graduation and College Matriculation Rates
Homeschool vs Public School: Academic & College Outcome Benchmarks
Outcome Comparison · 2026| Outcome Metric | Homeschool | Public School / Peers | Gap (Δ) |
|---|---|---|---|
| High School Completion Rate | 97% | 87% | +10 pts ▲ |
| Direct College Matriculation | 67% | 62% | +5 pts ▲ |
| Average ACT Composite | 22.8 | 19.8 | +3.0 ▲ |
| Average SAT Combined Score | 1135 | 1028 | +107 ▲ |
| Fourth-Year Cumulative College GPA | 3.46 | 3.16 | +0.30 ▲ |
| Four-Year College Graduation Rate | 66.7% | 57.5% | +9.2 pts ▲ |
| Six-Year Degree Completion | 74% | 62% | +12 pts ▲ |
| Remedial College Coursework Required | 12% | 32% | -20 pts ▼ |
- Home-educated high schoolers achieve an estimated secondary completion rate of 97%, outpacing the national public school four-year adjusted cohort rate of 87%.
- Post-secondary enrollment audits indicate 67% of homeschooled graduates matriculate directly into two-year or four-year universities, compared to 62% of public high school graduates.
- Standardized ACT evaluations record home-educated test-takers at an average composite score of 22.8, outperforming the national public school average of 19.8 by three full points.
- On the SAT examination, home-educated seniors post an average combined score of 1135, exceeding the national public school average of 1028 by 107 points.
- Dual-enrollment participation among homeschooled high school upperclassmen reaches 58%, allowing them to earn an average of 14.2 college credits before receiving their high school credential.
- Institutional public schools record an average four-year graduation rate for economically disadvantaged students of 81%, six points behind the national public average.
- Admissions surveys of competitive private colleges show 78% of admissions officers evaluate home-educated transcripts as equivalent or superior to public school diplomas.
- National Merit Scholarship semifinalist status is earned by home-educated high school seniors at a rate 2.3 times higher than the national public school average.
Annual Costs: Family Out-of-Pocket Expenses vs Public Per-Pupil Spending
- Current operational spending in United States public schools reached $17,619 per pupil in fiscal year 2024, with baseline projections exceeding $18,400 for the 2025-2026 school year.
- Homeschooling families spend an average of $600 to $2,500 out of pocket per child annually on textbooks, software licenses, laboratory supplies, and co-op dues.
- Curriculum materials constitute the largest recurring outlay for home educators, averaging $450 to $950 per child for a standard grade-level suite.
- Public school parents spend an average of $890 annually on mandatory fees, athletic uniforms, classroom supply kits, and field trips.
- In seventeen states operating universal Education Savings Accounts, qualifying families receive between $7,200 and $9,100 per student each year for certified instructional expenses.
- State taxpayers save an estimated $15,000 or more in operational expenditures for every student educated at home who does not occupy an institutional seat.
- The forgone wage or household opportunity cost for a parent leaving full-time work to direct home instruction averages $48,000 to $65,000 annually.
- Educational technology expenses for home education average $350 per pupil each year, allocated toward adaptive digital instruction, online tutoring, and testing subscriptions.
School Safety Concerns, Bullying Incidence, and Mental Health Trends
- Federal school crime statistics document that 19% of public school students ages twelve through eighteen report being bullied on school grounds each year.
- Bullying incidence peaks sharply in middle schools, where 27% of sixth graders and 26% of seventh graders report ongoing peer harassment.
- Electronic bullying affects 16% of public school teenagers, with female students reporting cyber harassment at rates 1.5 times higher than male classmates.
- School Pulse tracking reveals that only 48% of public schools report adequate operational capacity to deliver required mental health services to students.
- Post-withdrawal surveys show that 79% of families whose children experienced bullying in public schools reported marked emotional recovery within six months at home.
- Physical fight rates on public middle and high school campuses involve 21% of enrolled male students annually, compared to negligible violence rates recorded in home co-ops.
- Adolescent health surveys identify symptoms of chronic clinical anxiety in 32% of public high schoolers versus 14% of home-educated teenagers.
- Physical security and weapon fears prompted 61% of families entering home education in 2025 to cite safety concerns as an influential decision factor.
Special Education Outcomes and Neurodivergent Student Support
- Surveys indicate that 38% of home-educated students have special educational needs or neurodivergent profiles, including ADHD, autism spectrum conditions, and dyslexia.
- Federal tracking records that 15% of public school students receive individualized accommodations through formal Individualized Education Programs (IEPs).
- Among parents homeschooling neurodivergent students, 86% report substantial reductions in sensory fatigue, behavioral meltdowns, and classroom anxiety.
- Administrative data shows that 62% of families who withdrew special needs students from public districts cited unfulfilled IEP accommodations as their chief catalyst.
- Reading intervention progress accelerates by an average of 1.8 grade levels during the first twelve months of tailored home phonetic instruction for dyslexic pupils.
- Public school special education programs report a 21% national staffing shortage of credentialed special education instructors across public districts.
- Parent satisfaction with special education delivery registers at 89% among home educators, compared to 34% among public school parents attending annual IEP reviews.
- Therapeutic services including private speech pathology and occupational therapy are coordinated through hybrid co-ops by 47% of neurodivergent homeschooling families.
Socialization, Extracurricular Involvement, and Peer Engagement Data
- A synthesis of peer-reviewed socialization studies confirms that 87% of published papers identify equal or superior emotional development in home-educated children compared to institutional peers.
- Home-educated children participate in an average of 5.2 organized community and extracurricular activities outside the home each week.
- Parents document an average of 11.5 hours per week committed to community athletic leagues, fine arts classes, academic co-ops, and local volunteer initiatives.
- Standardized psychological batteries evaluate homeschooled youths in the 78th percentile for self-concept, social maturity, and peer cooperation.
- Regular attendance in multi-age co-ops reaches 72% among homeschool households, engaging children in collaborative projects across diverse age brackets.
- In traditional public high schools, 41% of enrolled students report feeling disconnected or isolated from their school community.
- Civic volunteering rates among home-educated adolescents stand at 64%, compared to 39% among public school teenagers of the same age bracket.
- Screen time monitoring indicates home-educated teenagers average 2.1 fewer hours of non-academic daily screen use than traditional public school students.
Standardized Testing and Academic Percentile Benchmarks
- Home-educated students score between the 85th and 87th percentile on nationally normed standardized achievement tests, against the national norm median of the 50th percentile.
- Across published academic literature, 62% of peer-reviewed studies on academic achievement report statistically superior results for home-educated students over students in institutional schools.
- In direct comparison studies, home-educated students typically score 15 to 25 percentile points above public school students.
- Parental formal education shows a modest influence on homeschool scores: students whose parents lack collegiate degrees still average at the 83rd percentile.
- Public school fourth-grade reading assessments show only 33% of tested pupils performing at or above the proficient level on national metrics.
- Public school eighth-grade mathematics proficiency stands at 28%, reflecting an ongoing recovery delay from earlier national score drops.
- Controlling for family income, low-income home-educated students average at the 72nd percentile, outscoring low-income public school peers by 22 to 24 percentile points.
- Composite standardized test score differences between boys and girls disappear in home education settings, with both groups averaging within 1.5 percentile points of each other.
National Enrollment and K-12 Market Share Comparisons
- Total homeschool enrollment across the United States reached 3.7 million students in 2026, increasing from 3.4 million in 2024.
- Home-educated children now account for 6.7% of the entire K-12 school-age population nationwide.
- Traditional public school enrollments stand at 49.4 million students, down from a pre-2020 peak of 50.8 million in 2019.
- Annual growth in home-based instruction holds steady at 5.1% year-over-year, which is nearly three times the pre-2020 annual growth rate of 1.8%.
- In states with low regulatory friction such as Alaska and North Carolina, homeschooled students represent approximately 9.8% and 9.4% of all school-age children.
- Thirty-six percent of state education departments that track registration recorded their highest historical homeschool enrollment totals between 2024 and 2026.
- Long-term federal projections indicate public school rolls will contract to roughly 46.9 million students by 2031 due to declining birth rates and alternative schooling choices. The shrinking public district headcount behind those projections is detailed in our U.S. public school enrollment statistics.
- Approximately 33% of American families now choose an educational delivery model other than their assigned neighborhood public school when counting homeschoolers, charter pupils, and private voucher recipients.
College Performance, Degree Attainment, and Cumulative GPA
- Institutional collegiate data reveals that home-educated undergraduates maintain a fourth-year cumulative GPA of 3.46, compared to 3.16 for traditionally educated peers.
- First-year academic records show home-educated students achieving an initial freshman GPA of 3.41, outpacing the general freshman average of 3.12.
- Four-year university graduation rates reach 66.7% for homeschooled students, surpassing the 57.5% benchmark recorded for general public school cohorts.
- Fall-to-fall freshman retention rates stand at 88.6% for homeschooled undergraduates, exceeding the national institutional average of 87.6%.
- Dean’s List recognitions and undergraduate honors are awarded to home-educated students at a rate 1.4 times greater than the broader student body.
- Remedial coursework requirements in freshman college math or English apply to only 12% of homeschooled entrants, compared to 32% of public school graduates.
- Faculty surveys rate former homeschoolers 24% higher on independent research capability and project time management during upper-division collegiate study.
- Six-year post-secondary degree completion registers at 74% for home-educated university entrants, against a national public school cohort average of 62%.
Instructional Time Allocation and Teacher-to-Student Ratios
- Classroom observational studies reveal that traditional public schools allocate an average of 67.5 minutes per day to active, strategic learning behavior out of a standard seven-hour schedule.
- Home-educated students complete equivalent daily academic workloads in 2 to 3.5 hours of direct instruction, saving over 500 hours of idle logistical time annually.
- The student-to-teacher ratio in home learning environments averages between 1:1 and 1:3, compared to an average public school classroom ratio of 16:1 nationwide.
- Instructional transition loss in public school classrooms consumes an average of 45 to 65 minutes daily through corridor movements, administrative tasks, and disciplinary interruptions.
- One-on-one instructional pacing allows home-educated elementary students to advance through reading and math modules at 1.4 times the speed of group-paced classrooms.
- Secondary home-educated students spend an average of 14 hours per week in self-directed study, compared to 4.5 hours of independent homework among district peers.
- Science laboratory hours in collaborative home co-ops average 2.5 hours of direct experimentation weekly, against 1.2 hours in standard public secondary biology courses.
- Academic efficiency gains allow 43% of homeschooled high schoolers to begin accredited college coursework or vocational apprenticeships by age sixteen.
State Regulatory Tiers and Compulsory Attendance Oversight
- Eleven states, representing 22% of the country, maintain zero-notice policies requiring no formal paperwork or notification to local school districts.
- Low-regulation statutes in 26% of states require only an initial or annual written declaration of intent to homeschool without mandatory curriculum approval.
- Moderate-regulation frameworks govern 44% of states, mandating standardized test submissions, professional portfolio reviews, or periodic progress evaluations.
- High-regulation mandates remain confined to 8% of states, where families must submit detailed quarterly syllabi, attendance logs, and certified test results.
- Annual legal dispute rates between home-educating parents and local superintendents stand at less than 0.05% across all registered families nationwide.
- Compulsory attendance laws in 34 states define homeschool educational equivalence by annual instruction hours, typically requiring between 900 and 1000 hours per year.
- District compliance audits reveal that 98.2% of homeschooling families in regulated states submit required annual portfolios within statutory deadlines.
- Statutory revisions across eight states in 2024 and 2025 simplified filing requirements by eliminating mandatory standardized testing submissions in primary grades.
Adult Civic Engagement and Long-Term Workforce Earnings
- Longitudinal polling data confirms that 74% of home-educated adults aged eighteen through twenty-four vote in national elections, compared to 42% of their general public peers.
- Adults educated at home participate in community service organizations at a rate of 71%, compared to 37% among traditionally schooled adults.
- Entrepreneurship metrics reveal that home-educated adults are 2.2 times more likely to establish their own business or pursue self-employment than public school alumni.
- Median individual earnings for adults who were homeschooled register 8% to 12% above national medians when controlling for parental income and formal credentialing.
- Civic literacy surveys indicate former homeschoolers score in the 82nd percentile on objective constitutional knowledge tests, versus the 51st percentile for public school cohorts.
- Membership in professional trade associations or civic boards involves 48% of home-educated adults by age thirty, compared to 31% across national peers.
- Home-educated adults report life satisfaction indices at 84% positive, compared to a national general population baseline of 72%.
- Charitable financial giving among former homeschoolers averages 4.5% of household income, outperforming the national adult giving average of 2.1%.
Demographics, Household Income, and Racial Diversity Shifts
- Non-white and non-Hispanic families account for 41% of the United States homeschooling population, up from less than 22% a decade ago.
- Black student enrollment represents the fastest-growing demographic slice in home education, expanding from roughly 3% of all homeschoolers before 2020 to 9.5% in 2026.
- Hispanic students now comprise 16.2% of the national home-educated student count, reflecting rapid co-op formation in southwestern metropolitan corridors.
- Household income metrics show home-educating families distributed evenly: 33% earn below $50,000 annually, 34% earn between $50,000 and $100,000, and 33% report incomes exceeding $100,000.
- Public school demographics nationwide record 45% white students, 28% Hispanic students, 15% Black students, 6% Asian students, and 6% multi-racial or other groups.
- The average family size among home-educating households stands at 2.8 school-age children, contrasted with an average of 1.9 children in public school households.
- Dual-earner households now comprise 26% of homeschooling arrangements, using alternating shifts, remote work schedules, and shared co-operative instruction.
- Geographic distribution figures confirm that 42% of homeschooled children reside in suburban communities, 31% live in rural zones, and 27% reside in central cities.
School Choice Expansion, Education Savings Accounts, and Tax-Credit Vouchers
- Seventeen states now operate active Education Savings Account (ESA) or universal voucher policies covering home-educated and alternative-model students.
- State voucher distributions under universal ESA frameworks provide eligible families with annual funding between $7,200 and $9,100 per enrolled child.
- In Arizona, participating students using universal ESA accounts surpassed 82,000 pupils in 2025, with 18% allocating funds to home curriculum or tutoring co-ops.
- Florida scholarship programs now distribute state funds to more than 420,000 alternative and private students, representing over 14% of the state school-age total.
- Surveys show that 63% of ESA funds spent by home-educating parents go toward accredited curricula, adaptive digital software, and individual tutoring.
- State budget analyses show universal ESA programs capture an average of 65% to 75% of the baseline per-pupil state foundation allocation, leaving local property tax shares with district schools.
- Parent participation in state-funded tax-credit scholarship initiatives grew by 42% between 2023 and 2026 across early-adopting Midwestern and Southern states.
- District revenue impact studies calculate that traditional public systems retain approximately $3,200 per departing pupil in local revenues without incurring operational instruction costs.
Recent Developments
- Hybrid homeschool models operating three days at home and two days in collaborative brick-and-mortar academies grew by 28% between 2024 and 2026.
- Microschool facilities operating under home education legal statutes reached 95,000 units nationwide in 2026, serving an estimated 1.8 million students.
- Artificial intelligence platforms for adaptive diagnostic tutoring and curriculum customization are now used by 46% of homeschooling parents on a weekly basis.
- More than 120 public school districts across fifteen states initiated facility consolidation or elementary closures in 2025 due to enrollment losses to home and choice models.
- State athletic associations in 38 states now permit homeschooled students to compete on public school sports teams under equal-access statutes known as Tim Tebow laws.
- Employer apprenticeship programs accepting certified home-education portfolios in lieu of regional district diplomas increased by 35% over the past twenty-four months.
- Public district virtual school programs experienced an enrollment drop of 18% as parents transitioned from district-monitored screens to independent co-op instruction.
- Shared co-operative facilities sharing science laboratories and art studios expanded to over 14,000 locations across suburban corridors by early 2026.
Editor’s Choice
- The standardized testing advantage for home-educated cohorts persists at 15 to 25 percentile points above public school students in direct comparison studies, even after controlling for parental education and household income.
- American taxpayers expend an average of $17,619 per public school student annually, while home-educating parents achieve comparable or superior academic benchmarks on an average personal outlay of $600 to $2,500.
- Concerns over safety, drug exposure, and peer pressure are cited by 80% of homeschooling parents as a reason for leaving, making school environment a more widely cited catalyst than academic dissatisfaction at 73%.
- Neurodivergent learners comprise 38% of the home education population, where individualized instruction yields an 89% parental satisfaction rating against 34% in traditional IEP programs.
- Home-educated university students maintain a 3.46 cumulative fourth-year GPA and a 66.7% four-year graduation rate, outperforming national public school collegiate cohorts.
- Universal Education Savings Account programs across seventeen states provide qualifying families up to $9,100 annually, accelerating hybrid learning models.
- More than 95,000 microschools now operate across the United States, providing small-group instructional environments for 1.8 million students registered under state homeschool provisions.
Frequently Asked Question
Home educated students typically score between the 85th and 87th percentile on national achievement tests, well above the 50th percentile national norm, and direct comparison studies place them 15 to 25 percentile points above public school students. Reading comprehension is their strongest subject at the 89th percentile, while only 40 percent of public high school seniors meet college readiness benchmarks in reading.
Families educating at home spend an average of $600 to $2,500 in personal expenses per child each year, whereas public school districts expend an average of $17,619 in taxpayer operational funds per pupil annually. Additionally, universal education savings accounts in 17 states now provide eligible parents with $7,200 to $9,100 per student annually to offset approved instructional costs.
Studies show that 87 percent of peer reviewed research finds equal or superior emotional and social development in home taught children, who participate in an average of 5.2 community activities outside the home every week. Parents also report that their children average 11.5 hours weekly in athletic leagues, volunteer projects, and multi age learning cooperatives.
Home education enrollment reached approximately 3.7 million students in 2026, which represents roughly 6.7 percent of the national school age population across the country. In contrast, traditional public school districts enroll 49.4 million pupils, with district rolls projected to contract to 46.9 million by 2031.
Homeschooled undergraduates maintain a fourth year cumulative grade point average of 3.46 compared to 3.16 for traditionally schooled cohorts, while graduating at a four year rate of 66.7 percent versus 57.5 percent for their conventional peers. Furthermore, 74 percent of home educated entrants complete their postsecondary degrees within six years, against a 62 percent national public average.
Conclusion
The statistical divide between home study and public classrooms reflects two contrasting educational architectures: one built on standardized collective delivery, the other on individualized pacing and parental oversight.
As seventeen state legislatures expand per-pupil funding flexibility, millions of American households continue trading institutional hallways for customized learning environments without incurring academic or collegiate penalties.
Sources and editing
This article cites state departments of education, the National Center for Education Statistics (NCES), U.S. Census Bureau Household Pulse surveys, and peer-reviewed research.
We may use AI tools to sort tables or improve wording. A human reviewer checks the numbers, citations, and claims before publication.